Goal of this exercise: Analyze the first study that used the CRISPR-Cas9 system (CASGEVY) as a treatment for Sickle cell disease (Frangoul et al. 2021), and compare this with an alternate treatment (Risto-cel) that utilizes base editing (Gupta et al. 2026). Part 2 simulates the CASGEVY approach to treating the disease, by using Case It v705 to locate and cut the BCL11 erythroid-specific enhancer sequence from Chromosome 2. BLAST and the Genome Data Viewer are then used to identify and visualize the location of the sgRNA target site on the enhancer.
Part 1: Overview of CRISPR-Cas9 and base editing treatments for Sickle cell disease.
Part 2: CRISPR-Cas9 exercise (this page). Use Case It v705 to locate and cut the BCL11A erythroid-specific enhancer, then use BLAST and the Genome Data Viewer to visualize the enhancer.
Part 3: Base editing exercise. Use Case It v705 to locate and edit BCL11A binding sites on the HBG1 and HBG2 promoters, then use BLAST and the Genome Data Viewer to identify and visualize binding sites in relation to gene location.
Organization of Part 2
Steps 1-9: Download Case It software and open the BCL11A gene sequence and Cas9 enzyme files.
Steps 10-12: Find the guide RNA target site on the BCL11A gene sequence.
Steps 13-20: Cut the sequence (located within the erythroid-specific enhancer for BCL11A) at the target site.
Steps 21-43: Use NCBI tools to visualize the BCL11A erythroid-specific enhancer
Step 44: Links to a separate exercise to search for and visualize the codon associated with the sickle-cell mutation using the NCBI Genome Data Viewer and compare the 3D structure of wild type and mutated hemoglobin using the Protein Data Bank visualization tool.
Questions/Exercises after Steps 12, 20, and 43
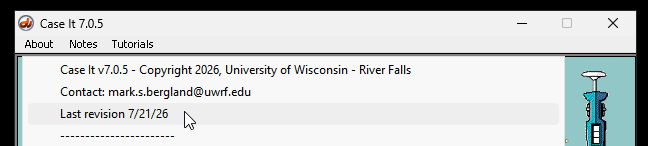
IMPORTANT! This exercise requires a revision of Case It v705 dated 07/21/26 or later. Check the About menu (upper left corner of screen) to make sure you are using the correct revision.
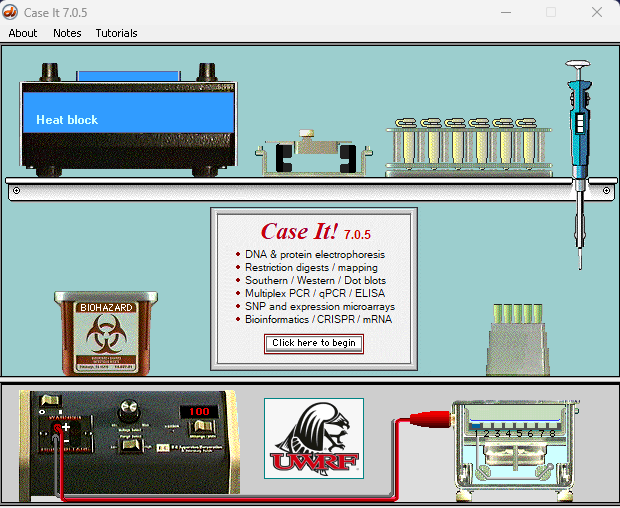
Step 1. Download and install Case It v705, using instructions available at the download page of the Case It web site. Double-click on the executable (Case It v705.exe), and click the button on the opening screen to begin. Note: Click this or any of the other images to enlarge.
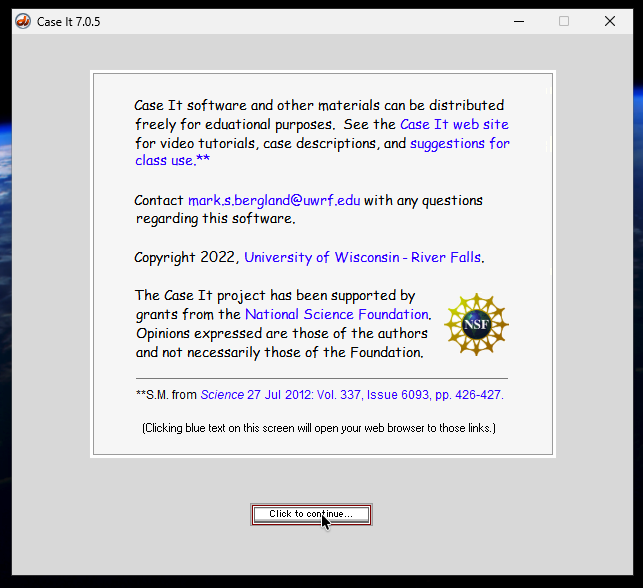
Step 2. Click the continue button on the second screen.
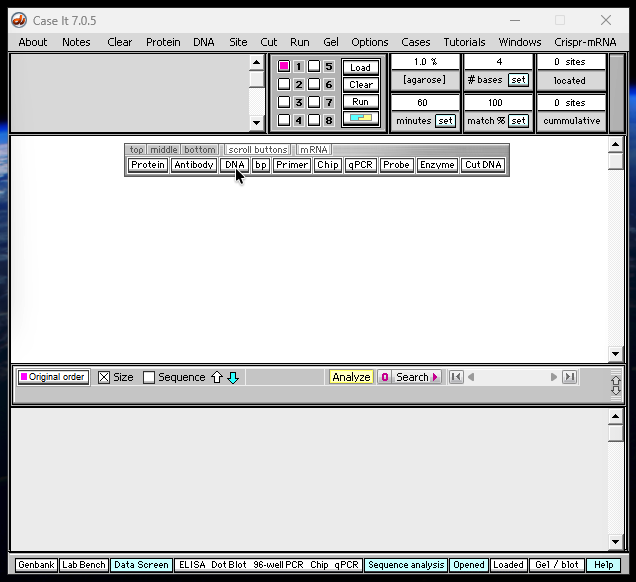
Step 3. Click the DNA button on the silver button bar.
Step 4. Navigate to the Sickle cell CRISPR data folder that is inside the Case It v705 folder. Note: do not open the ‘CRISPR data’ folder, which is used for a different exercise.
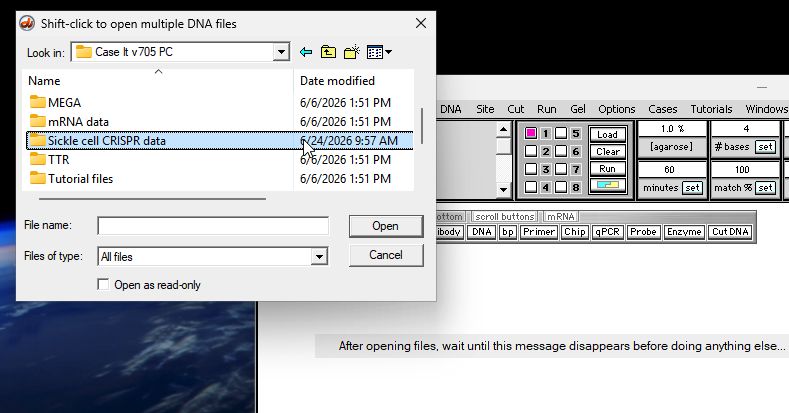
Step 5. Double-click on the file DNA BCL11A rev comp.
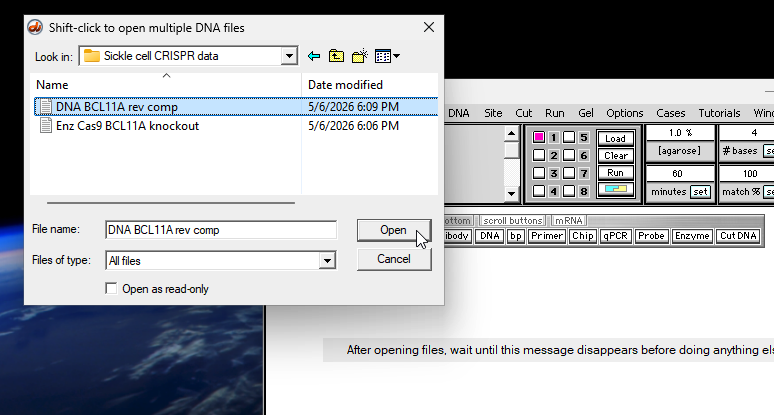
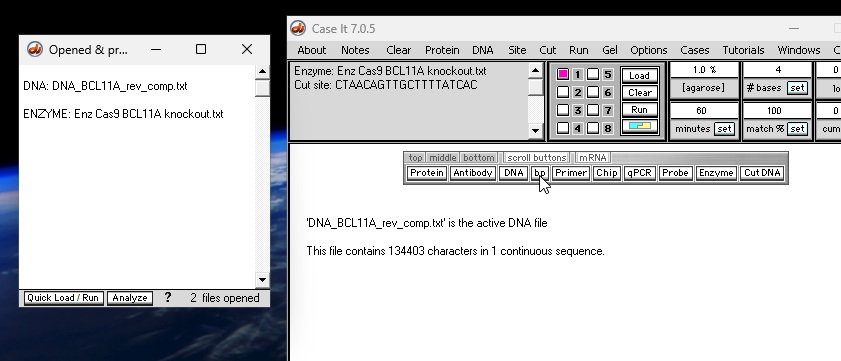
Step 6. Note that a line has appeared in the Opened & processed window showing the name of the DNA file, and that this file has 134403 characters in a single continuous sequence (see image below). This represents the entire sequence of the BCL11A gene, located on chromosome 2 of the human genome. Note: The name of the sequence includes “rev comp” because the order of the sequence is the reverse complement of the sequence provided on the NCBI site – see Part 3 for an explanation.
Step 7. Click the Enzyme button on the silver button bar.
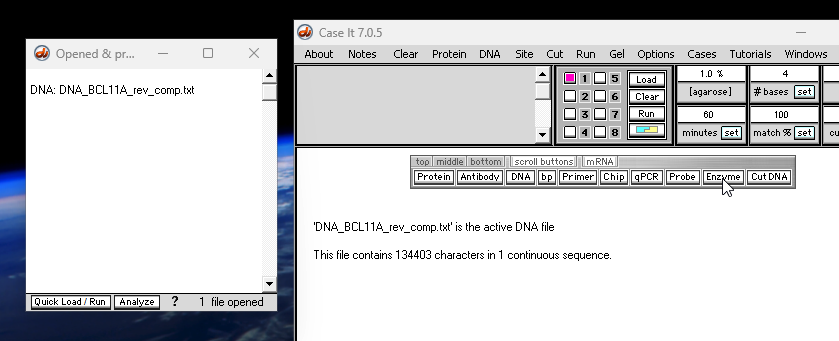
Step 8. Select the file Enz Cas9 BCL11A knockout.
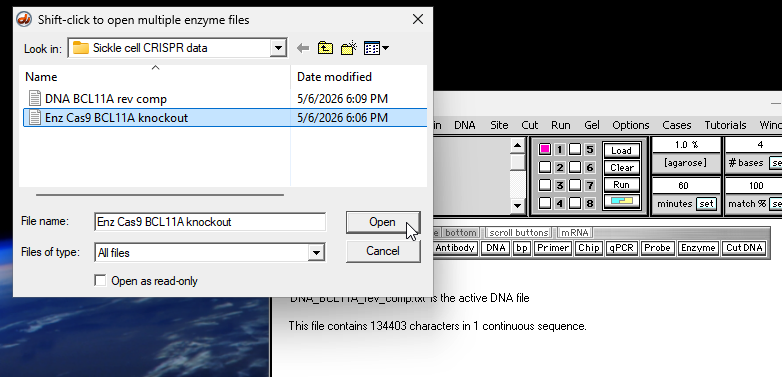
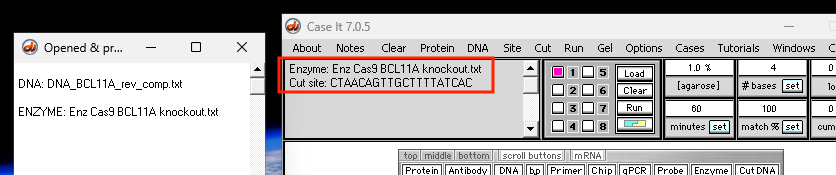
Step 9. Another line has appeared in the Opened & processed window showing the name of the opened file. That name also appears in the gray window at upper left of the Data Screen, along with the 20 bp sequence it contains.
Step 10. Click the small bp button on the silver button bar (see cursor location below).
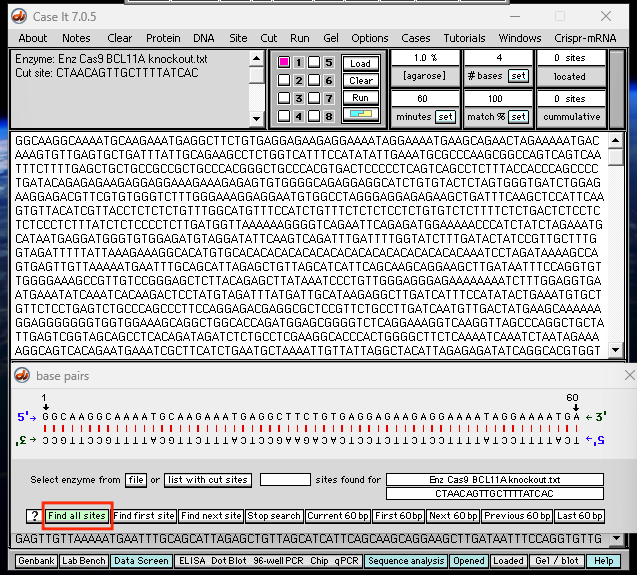
Step 11. The base pairs window appears showing the first 60 characters of the DNA sequence. Click the green Find all sites button (left side of Base pairs window).
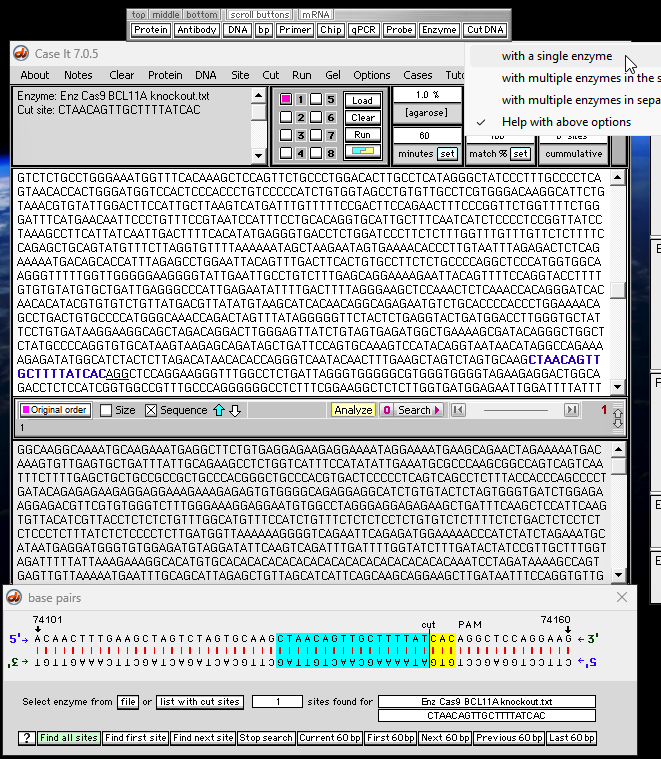
Step 12. If there are more than one site present, the hit indicated below would be the final one. Click the Find next site button to see if there are additional sites on this sequence (numbers indicating the beginning and end of the 60 bp sequence are shown in the base pairs window – in this case 74101 to 74160). Since those numbers don’t change when you click the Find next site button, you know that there is only one site on this DNA sequence that exactly matches the CTAACAGTTGCTTTTATCAC search sequence.
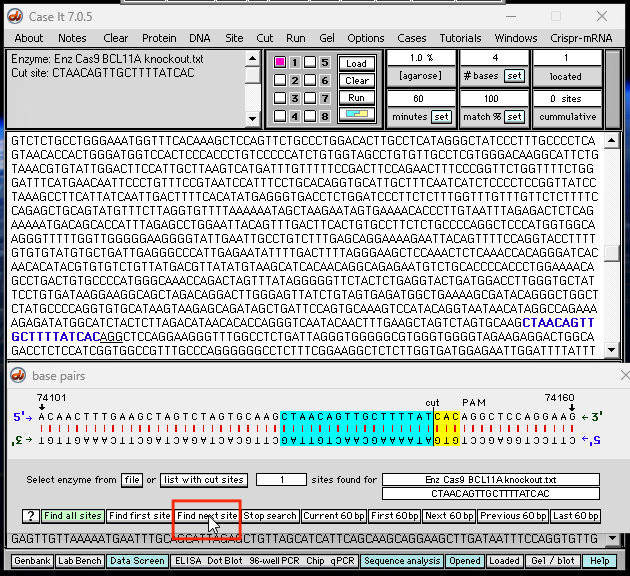
The site is shown above both in the upper field (blue letters with the PAM site underlined) and in the base pairs window (blue with yellow on either side of the cut site). Note that the PAM site is just to the right of the yellow sequence.
Questions: Note the relationship between the cut site and the blue and yellow regions above. Why is the cut site at this particular location? What is a PAM sequence, and why is particular one considered the canonical PAM sequence? What are some other PAM sequences that have been used in CRISPR research applications?
Step 13. Use the Cut DNA button on the silver button bar and select with a single enzyme, as shown below.
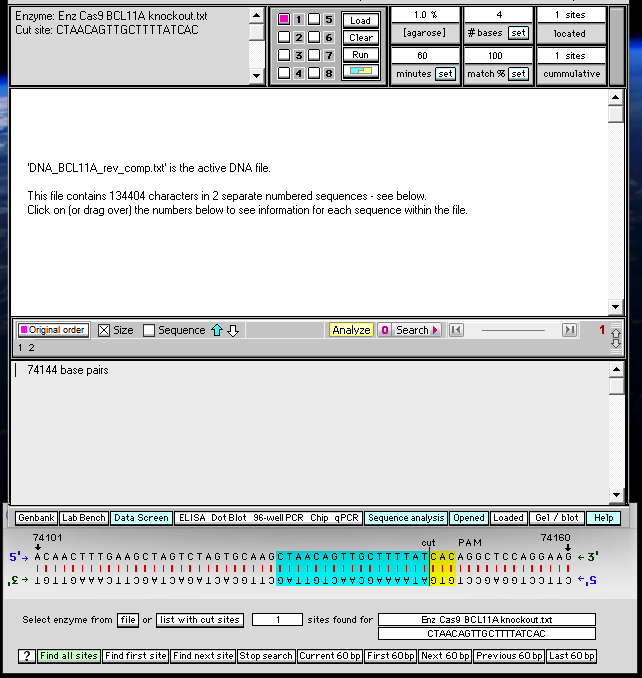
Step 14. A message appears indicating that there are now two DNA fragments, the first of which has a size of 74144 base pairs.
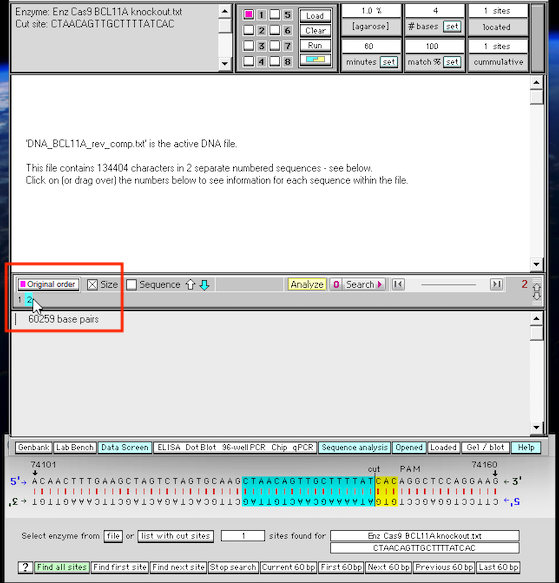
Step 15. Click the small number 2 (as shown below) to see the size of the second fragment.
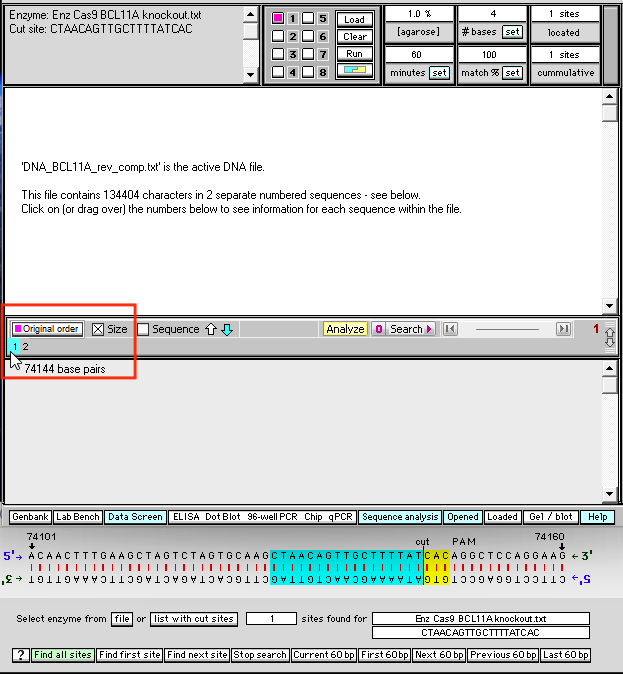
Step 16. Click the small number 1 (as shown below) to go back to the size of the first fragment.
Step 17. Click the Sequence checkbox to show the sequence of the first fragment.
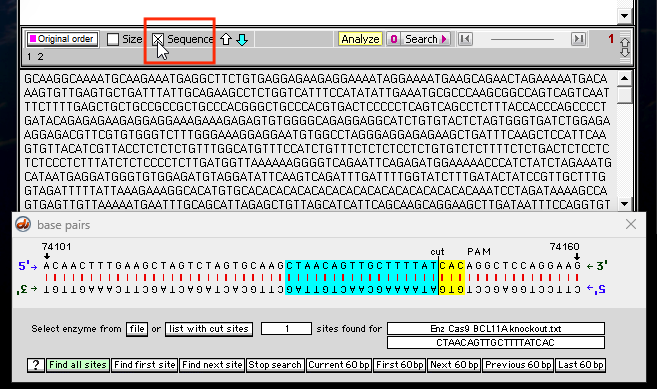
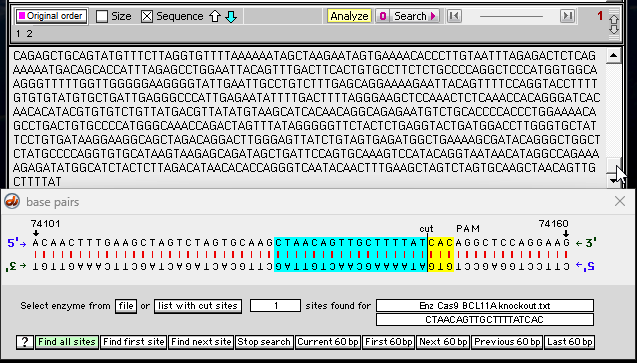
Step 18. Use the scrollbar on the right to scroll to the bottom of the first fragment. Note that the characters at the end of this sequence (CTAACAGTTGCTTTTAT) match the characters in blue, to the left of the cut site.
Step 19. Click the small number 2 to show the sequence of the second fragment.
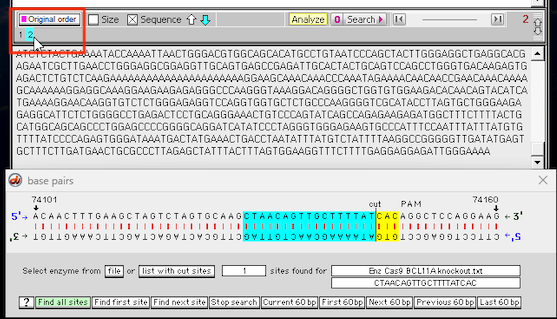
Step 20. Scroll to the top of the second fragment and examine the bases in blue and yellow above.
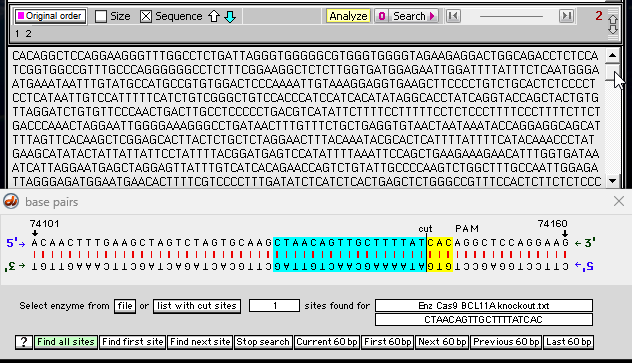
Questions: Does the sum of the two fragments equal the size of the original fragment? Examine the sequence of nucleotides in the immediate vicinity of the cut site. Why can cutting the BCL11A gene sequence at this particular location result in a permanent cure for sickle cell disease? That is, what is the chain of events at the molecular level that is initiated by cutting the BCL11A gene at this particular location?
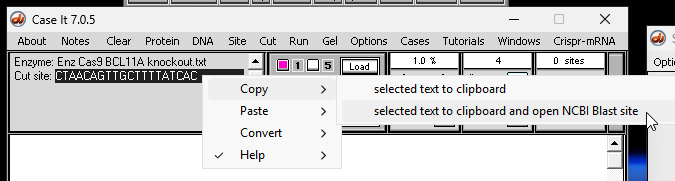
Step 21. Double-click on the cut site sequence to highlight it, then right-click on the highlighted sequence and select Copy -> selected text to clipboard and open NCBI Blast site.
Note: If Case It 705 is not open, you can copy the sequence CTAACAGTTGCTTTTATCAC and click here to open the NCBI Blast site).
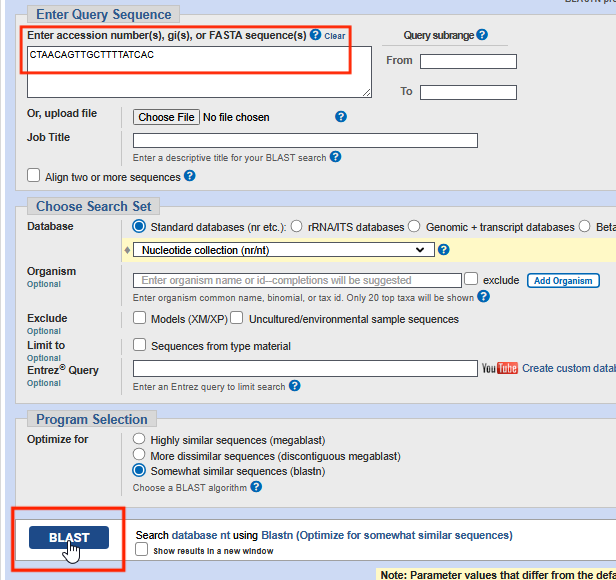
Step 22. Right-click in the field on the NCBI Blast site and paste the copied sequence into the field as shown below. Then scroll down and click the BLAST button at the bottom left-hand corner of the page.
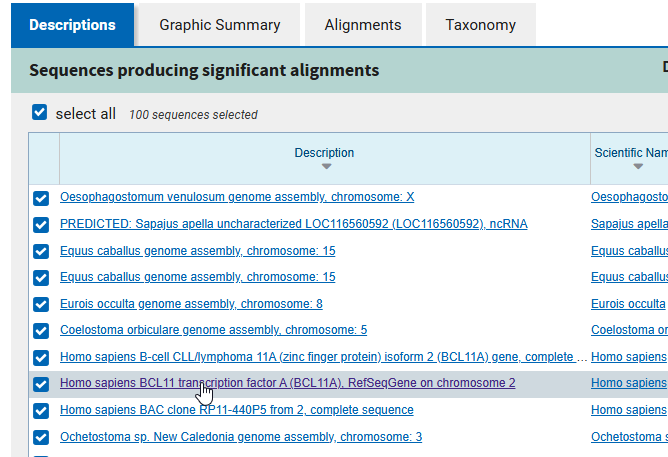
Step 23. Click on the Homo sapiens BCL11 transcription factor A line in the blast results as shown below.
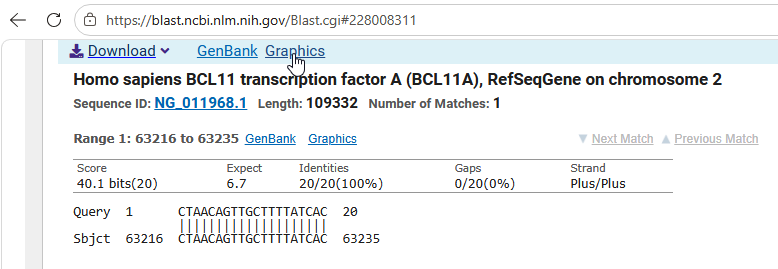
Step 24. That result should appear at the top of the page, showing a 100% Identities match (20/20). Click on the Graphics link at the top of the page.
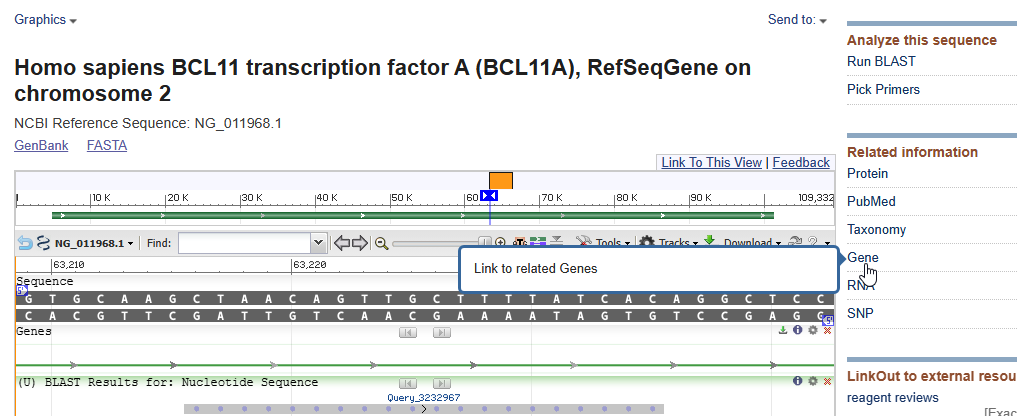
Step 25. The sequence location for the transcription factor will appear. Click Gene on the right side of the page.
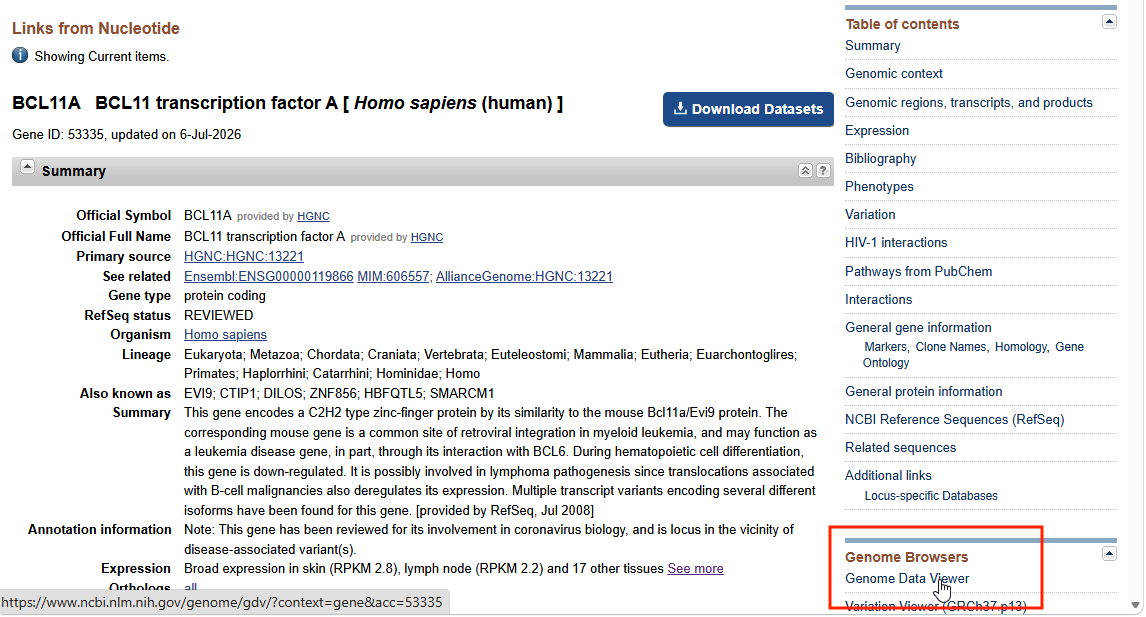
Step 26. A page will appear in the Gene website giving much information about the BCL11A transcription factor (as indicated by the table of contents for this page on the right). After examining this page, click the link to the Genome Data Viewer shown in the red box below.
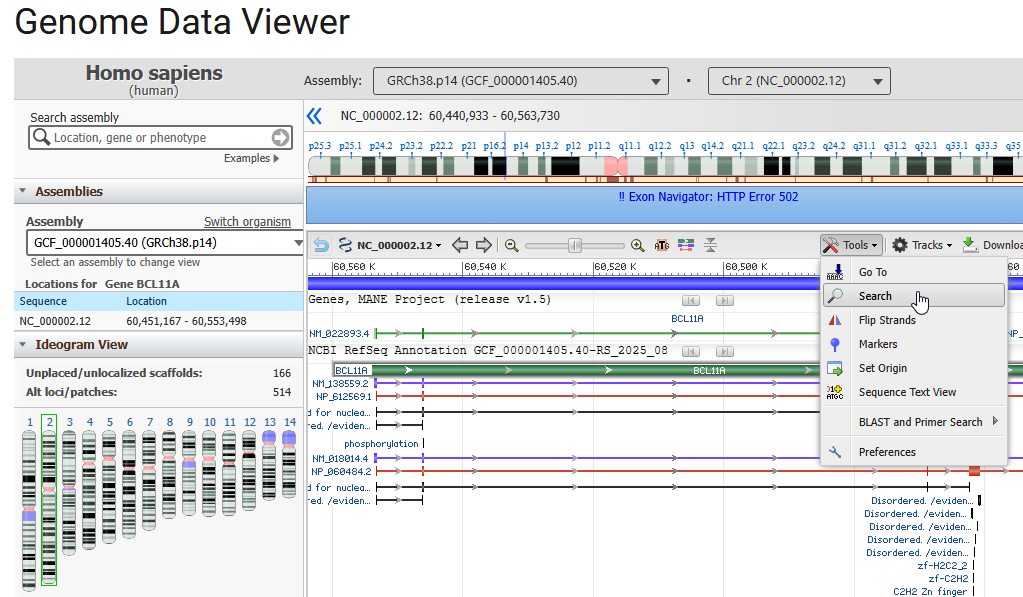
Step 27. The location of the BCL11A gene (that produces the transcription factor) is shown, located on Chromosome 2 – see graphic on far left. Click the Tools button and select Search.
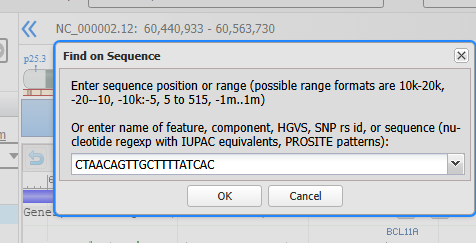
Step 28. The cut site sequence should still be on your computer’s clipboard, but if not here it is again: CTAACAGTTGCTTTTATCAC. Right-click in the search box and Paste this sequence into it, then click OK.
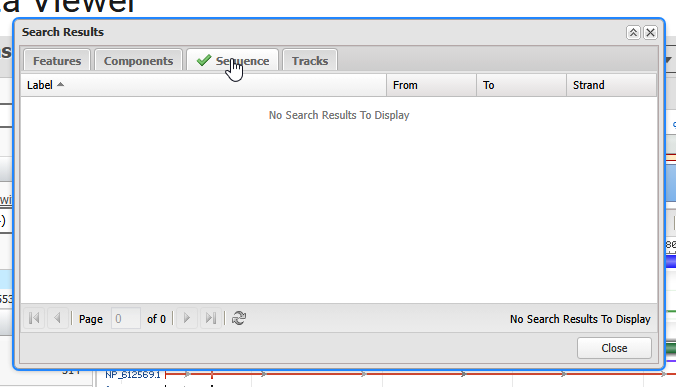
Step 29. If the sequence is found, a green checkmark will eventually appear on the Sequence tab of the search results box. Click Sequence tab after the checkmark appears.
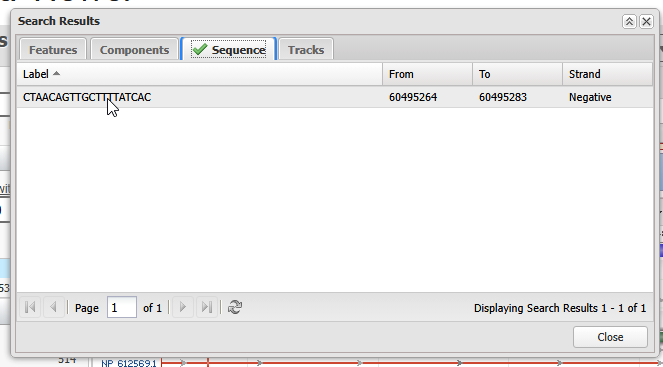
Step 30. The sequence will appear in the search results box. Double-click on the sequence as shown below, then Close the search results box (Close button at lower left or X button at upper right).
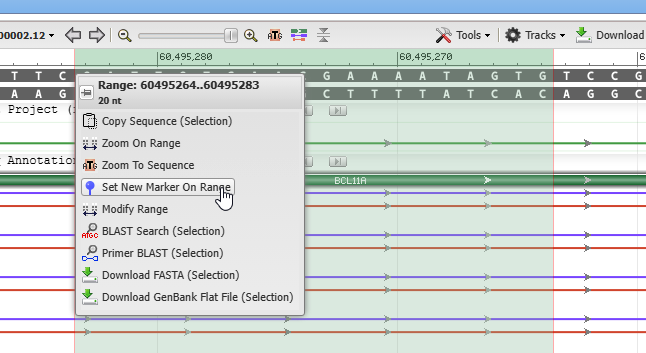
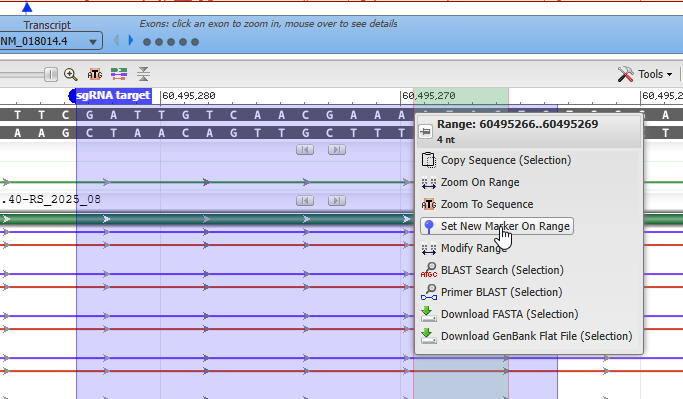
Step 31. The found sequence will be highlighted in pale green. To make this location easy to find later, move your mouse cursor to the top of the pale green area (in the region that shows the sequence position numbers), and a box will pop up. Select Set New Marker on Range.
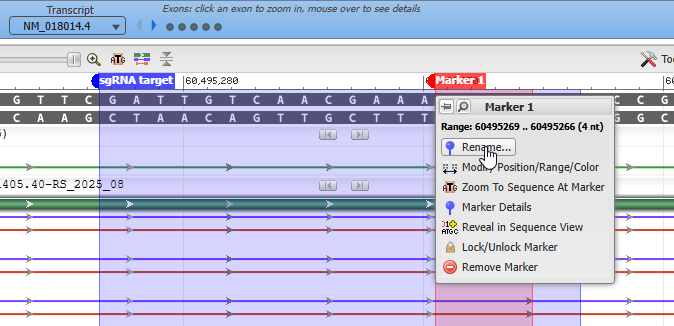
Step 32. The color that appears may be different than that shown below. If you would like to change it, you can use ‘Modify position/Range/Color’ to do so. We’ll stay with the purple color shown, and instead will select Rename.
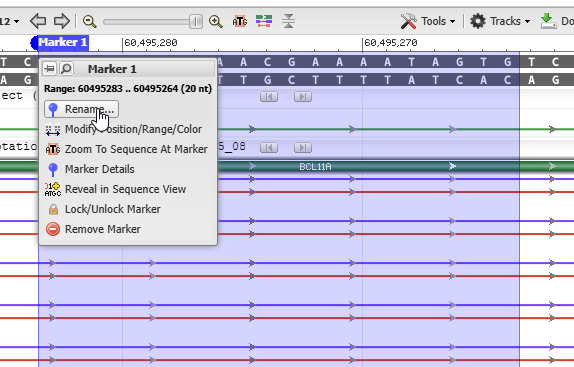
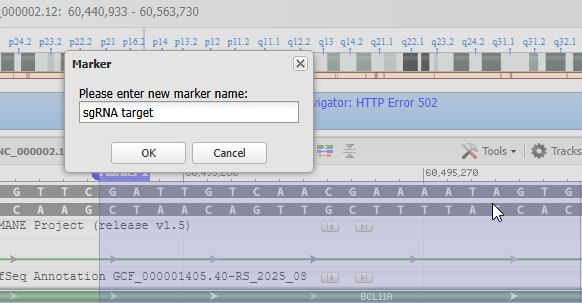
Step 33. Rename the marker sgRNA target (since this is the 20 bp sequence targeted by the sgRNA of CRISPR-Cas9), then click OK.
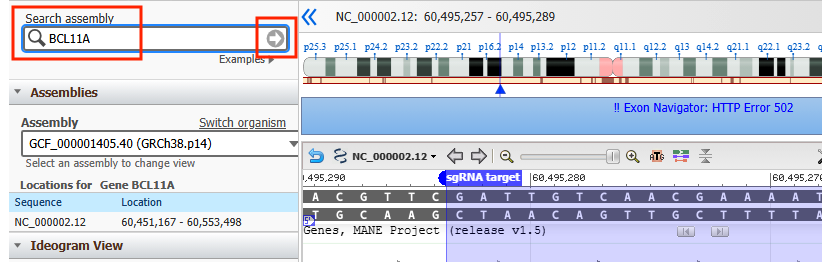
Step 34. There are several ways to zoom out and see the location of the sgRNA target sequence on the entire gene. One way is to type the name of the gene (BCL11A) into the search box, then click the arrow button to re-find the gene, as shown below. Note: We’ll use this method because it should reset the Exon Navigator, fixing the error message. If the message doesn’t disappear, you may need to refresh the page several times. There is also a zoom slider that is commonly used to zoom in and out, but using that right now may not reset the navigator. I
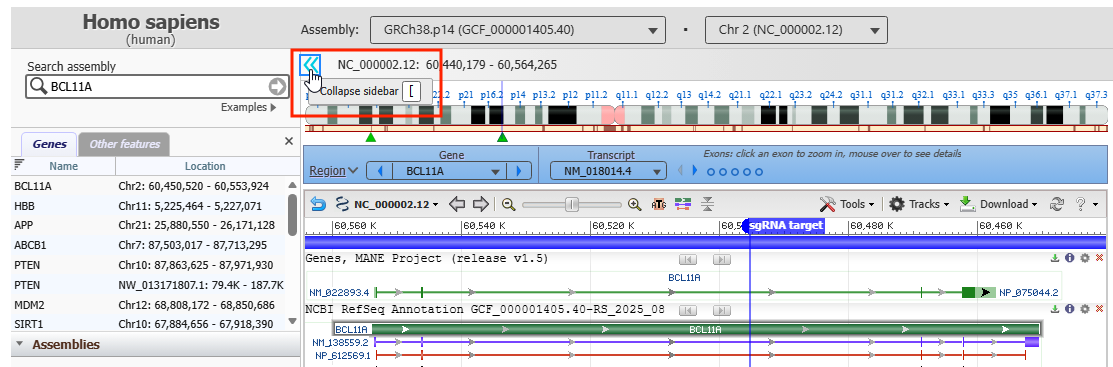
Step 35. A full view of the BCL11A gene will appear, withe the thin green line on top representing the location of introns and exons, and the marker representing the location of the sgRNA target site. Click the arrow icon in the red box to collapse the sidebar to give a wider view of the gene (click the image to enlarge).
Step 36. Hover your mouse over leftmost small circle on the blue bar so show the location of exon 1 (vertical red line that appears far left of gene).
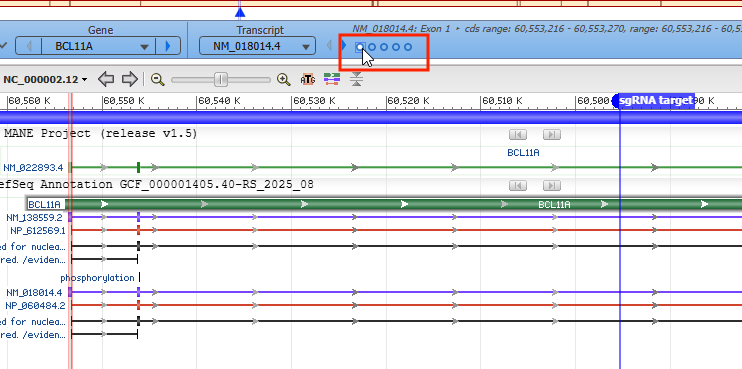
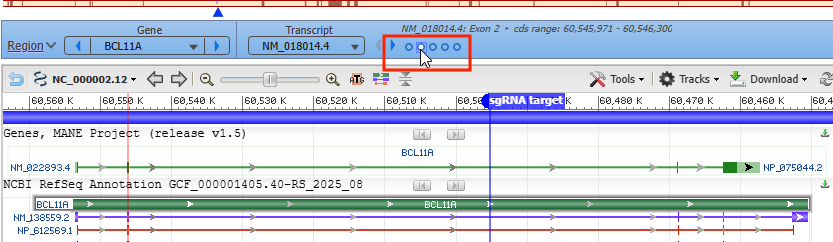
Step 37. Hover your mouse over the second small circle to see the location of exon 2 (note that the vertical red line has moved to the right), but it is still to the left of the sgRNA target site.
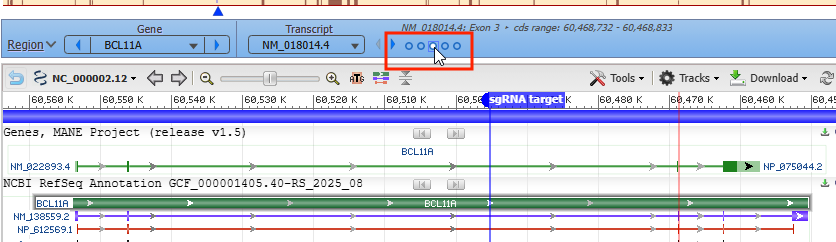
Step 38. Hover your mouse over the third small circle to see the location of exon 3. Since the red line is now to the right of the sgRNA target site, that site is located in the intron between exons 2 and 3. Therefore it is located in the intron between those two exons (intron 2).
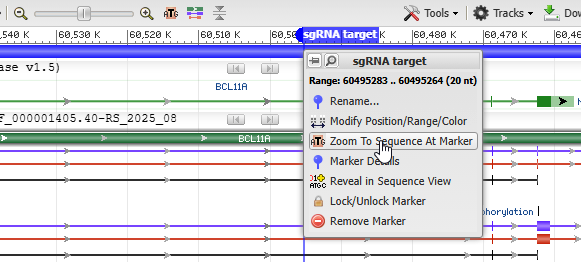
Step 39. Hover you mouse over the sgRNA target label and a pop-up menu appear. Select Zoom To Sequence At Marker.
Step 40. Place your mouse cursor in the white space above the highlighted sequence (the area that shows base pair number locations) and drag your cursor from left to right to highlight the region at A T A G.
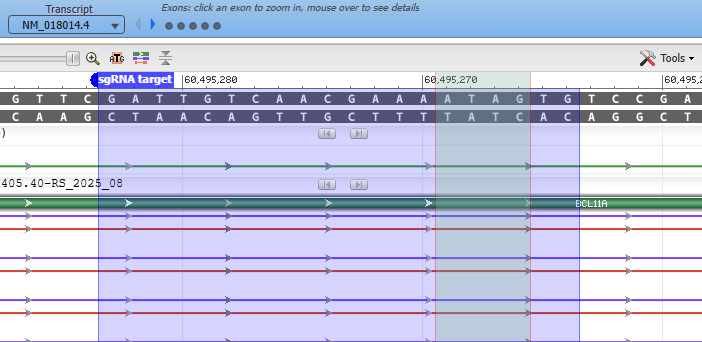
Step 41. Place your cursor in the highlighted green region and select Set New Marker On Range.
Step 42. Place your cursor on the Marker 1 label and select Rename from the pop-up menu. Name it “GATA“.
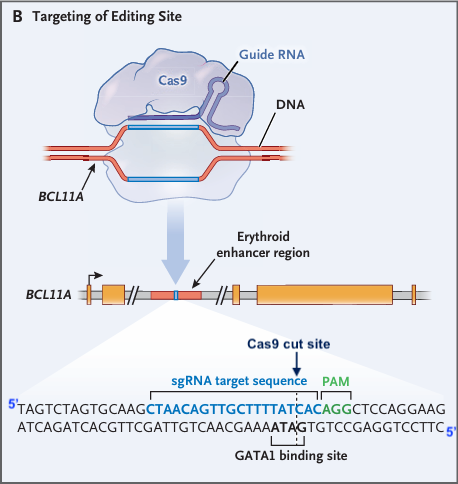
Step 43. Compare your labelled sequence with the illustration modified from Fig. 1 of Frangoul et al. 2021 (second graphic below). Note that the strands are upside down relative to one another, as indicated by the 5′ ends of each sequence. For this reason, the PAM sequence (AGG) in the Genome Data Viewer sequence is on the lower strand, whereas in the Fig. 1 sequence it is on the upper strand. Regardless, they represent the same base pair sequence. Note also that the Cas9 cut site would be three bp to the left of the PAM, between the A-T and G-C base pairs.
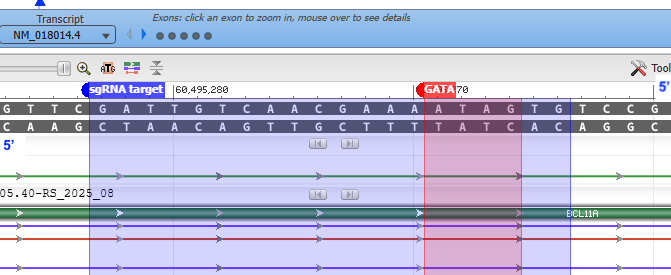
Figure 1 of Frangoul et al. 2021:
Exercise 1: Describe in detail what happens when the DNA sequence is cut in this particular location, relating it to the function of the enhancer-dependent chromatin rosette on the BCL11A gene, in terms of the CASGEVY treatment for sickle-cell disease. After doing this, refer back to Part 1 to check your answer.
Exercise 2:
(a) Try changing bases in the target sequence and search for these modified sequences using BLAST (Step 22 above) and the Genome Data Viewer (via the search tool in the Tools menu – Step 27) and see if you can determine the function of the off-target areas you identify.
(b) How easy is it to generate potential off target effects?
(c) In reality, how do researchers determine whether a particular CRISPR therapy is safe to use, given the potential for adverse effects when both strands of DNA sequences are cut?
(d) Why is base pair editing considered a safer alternative, at least in theory?
What other gene therapy approaches are currently under development, and how promising are they in terms of preliminary results?
Part 1: Overview of CRISPR-Cas9 and base editing treatments for Sickle cell disease.
Part 2: CRISPR-Cas9 exercise (this page). Use Case It v705 to locate and cut the BCL11A erythroid-specific enhancer, then use BLAST and the Genome Data Viewer to visualize the enhancer.
Part 3: Base editing exercise. Use Case It v705 to locate and edit BCL11A binding sites on the HBG1 and HBG2 promoters, then use BLAST and the Genome Data Viewer to identify and visualize binding sites in relation to gene location.
Step 44. The nature of the sickle cell mutation in the HBB gene is examined as part of a separate exercise, an extension of the original Sickle Cell case. Relevant links in this exercise are copied below. (Note: The Steps below refer to steps in that exercise, not the steps above).
Goal of Steps 6-17: To search for and visualize the codon associated with the sickle-cell mutation using the NCBI Genome Data Viewer.
Goal of Steps18-22: To compare the 3D structure of wild type and mutated hemoglobin using the Protein Data Bank visualization tool.