Note: This is an extension of the mobile version of the Sickle cell case.
(A related exercise on CRISPR and base editing for Sickle cell disease is also available).
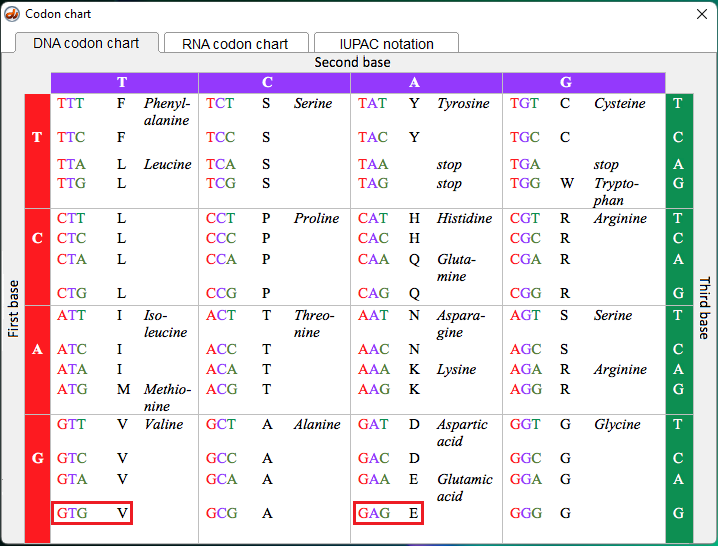
Background: MSTII is a restriction enzyme that recognizes CCTNAGG on a DNA sequence and cuts it between the C and the T (CC|TNAGG). The N can be either A, C, T, or G. The sickle-cell mutation changes one of the MSTII recognition sites from CCTGAGG to CCTGTGG, meaning that MSTII can no longer cut at this location. This mutation changes the codon from GAG (associated with glutamic acid) to GTG (associated with valine). It is this change that results in an abnormal shape for the hemoglobin molecule.
Goal of Steps 1-5: Visualize the effect of MSTII digestion on normal and sickle-cell DNA sequences, via screen-capture videos of the Case It search procedure.
Goal of Steps 6-17: To search for and visualize the codon associated with the sickle-cell mutation using the NCBI Genome Data Viewer.
Goal of Steps18-22: To compare the 3D structure of wild type and mutated hemoglobin using the Protein Data Bank visualization tool.
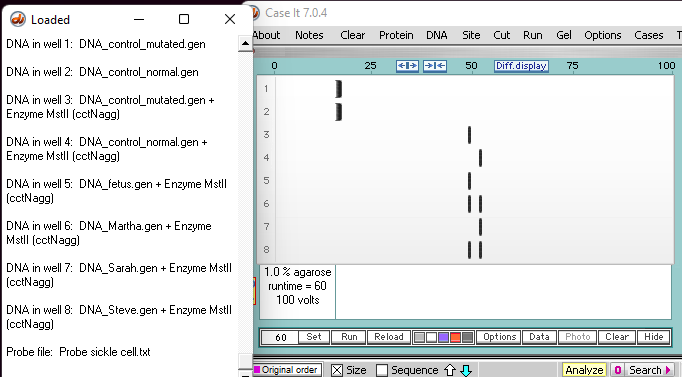
1. The Southern blot below has samples from Case A, with the addition of two undigested control samples in wells 1 and 2. The other wells contain samples digested with MSTII.
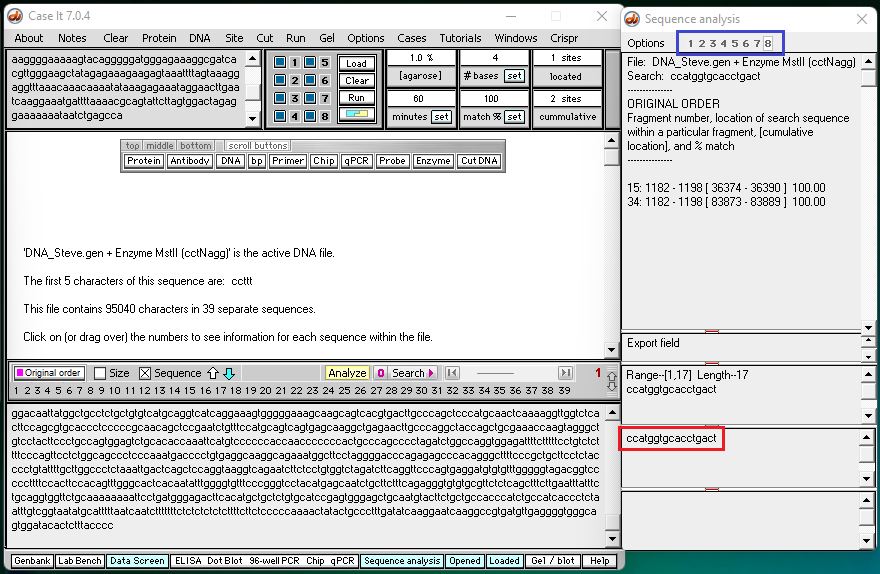
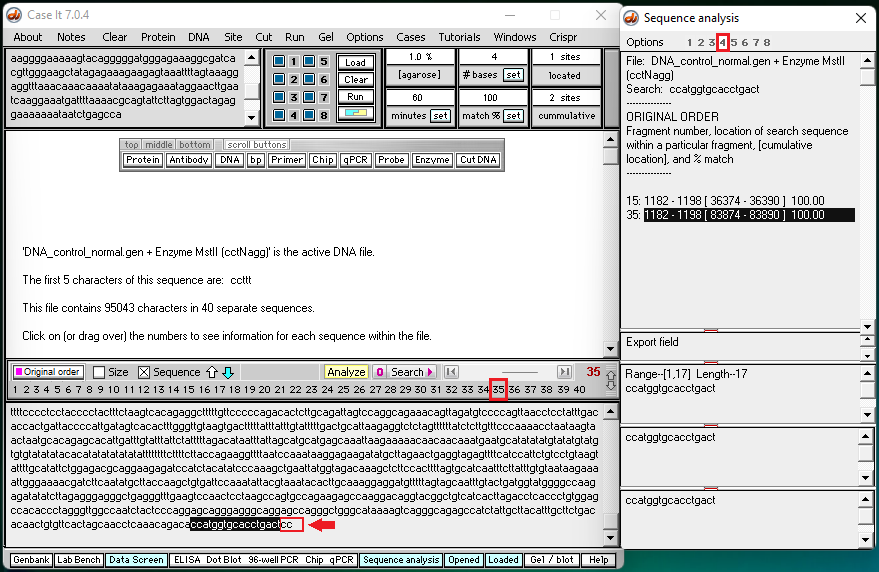
2. Click this link to see a video showing how the actual simulation searches all 8 wells for a sequence known to be adjacent to the particular MSTII site affected by the sickle-cell mutation. The screen shot below is from the end of this video.
Note: The search sequence (ccatggtgcacctgact) is shown in the red box below . As wells are searched, numbers appear at the top of the rightmost window (blue box). After the search is complete, clicking on a number will show the search result for a particular well (as show via video links in steps 3-5 below).
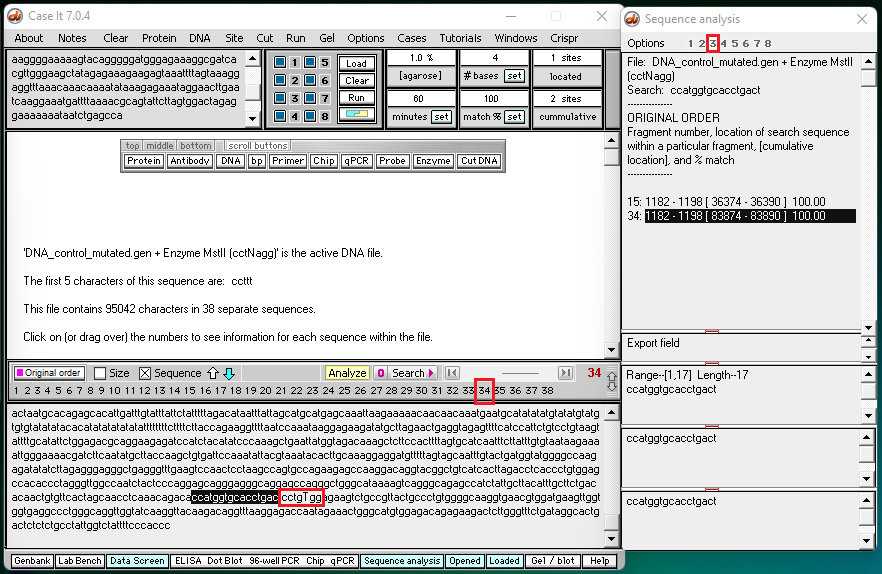
3. Click this link to see results for well 3, the well containing a control for the sickle cell mutation. A screen shot from the end of this video is shown below.
Note: There are 23 pairs of homologous chromosomes in the human genome, including the pair associated with chromosome 11. Before the Southern blot was run, the genome was digested with MSTII resulting in a series of DNA fragments, and then the fragments associated with the sickle cell mutation were identified using a probe. Fragment #15 represents a fragment from one member of the pair for chromosome 11, and fragment #34 represents a fragment from the other member of the pair for chromosome 11.
Question: Why were fragments #15 and #34 not cut by MSTII for the sickle cell control?
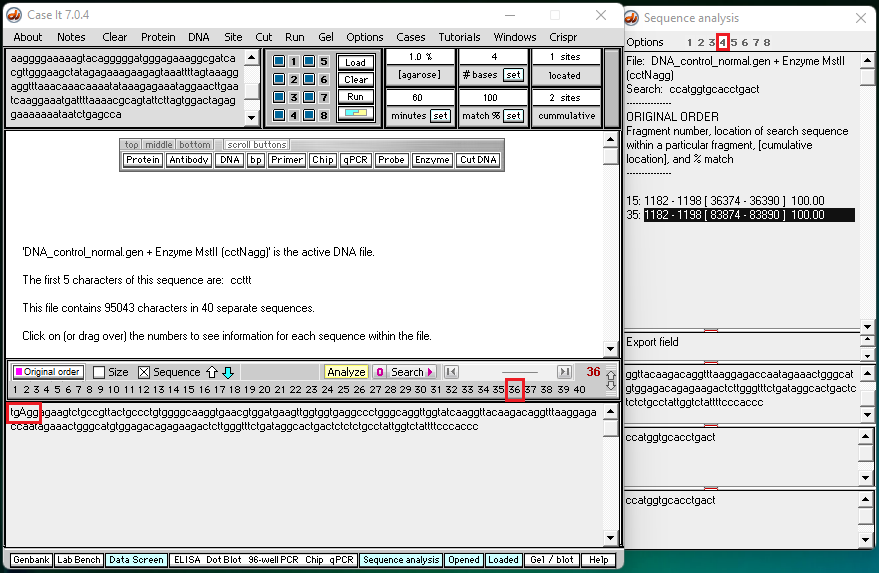
4. Click this link to see a video of search results for well 4 (control – normal). Two screen shots from the video (below) show the end of fragment #35 and the beginning of fragment #36.
5. Click this link to see a video of search results for well 6 (Martha).
Question: Based on the results from Steps 3 and 4 above, what is Martha’s genotype? What is her phenotype?
Goal of Steps 6-16: To search for and visualize the codon associated with the sickle-cell mutation using the NCBI Genome Data Viewer. Note: This part of the exercise should be done using a computer or tablet rather than a phone.
6. First, copy this search sequence: gagaagtctgccgtta
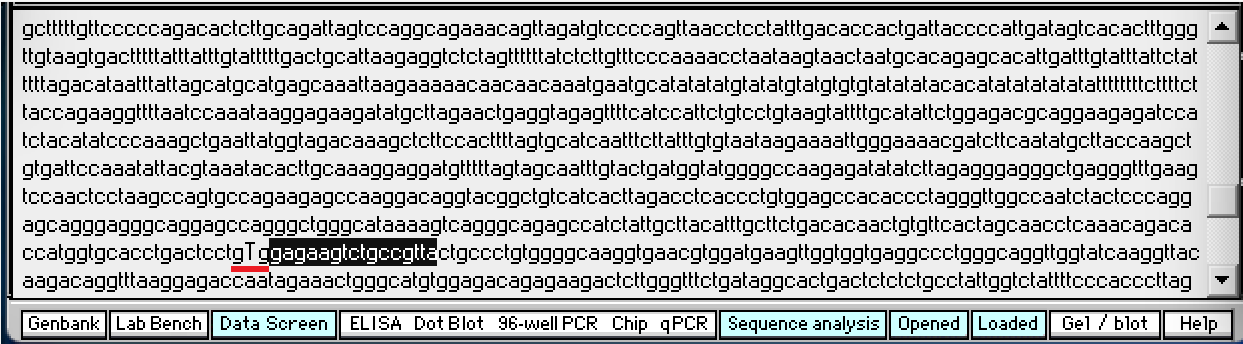
This search sequence will be used because it is located next to the codon that has the sickle-cell mutation (gTg), as shown below (underlined in red – click to enlarge).
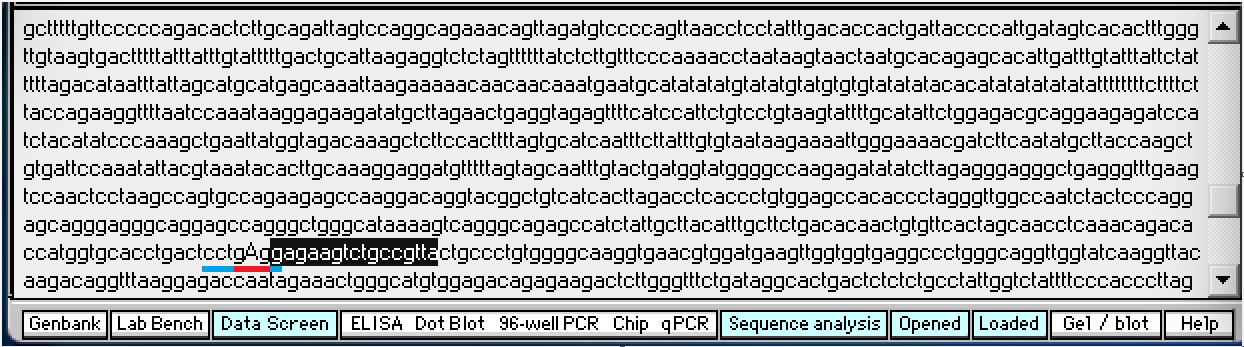
The normal codon is shown below (gAg), underlined in red. Blue has been added to either end of the red underline to show the recognition site for MSTII (cctgAgg). No blue has been added in the image above because MSTII cannot recognize the site due to the mutation.
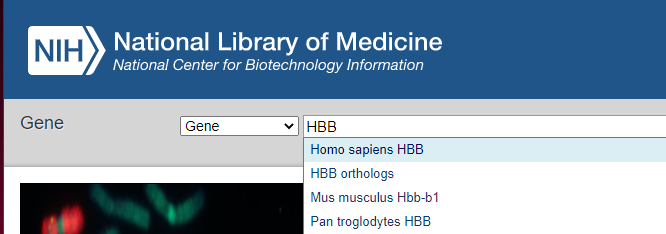
7. Click on this link to open your browser to the Gene web page of NCBI (National Center for Biotechnology Information), type HHB into the field as shown below, and select Homo sapiens HBB from the drop-down menu.
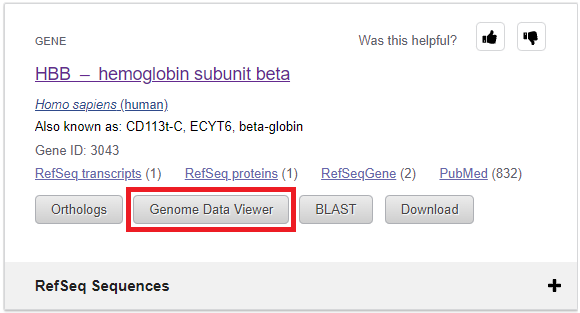
8. Click the Genome Data Viewer button on the page that appears.
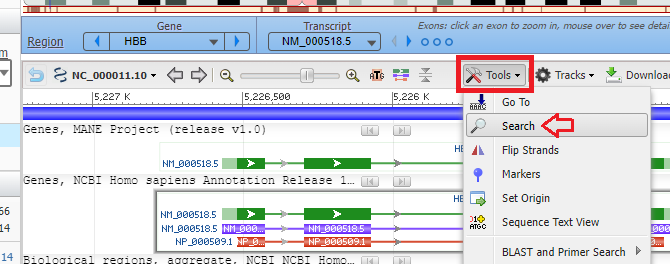
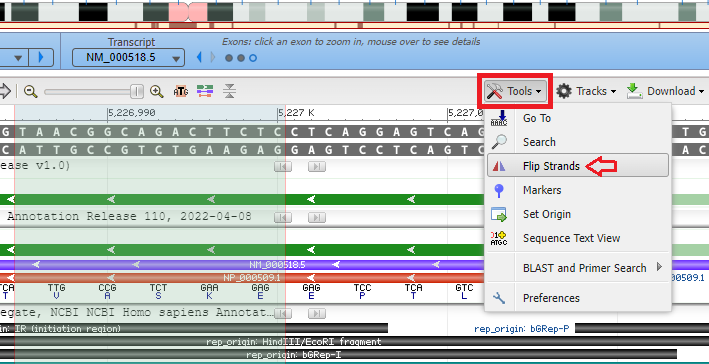
9. Click the tools button and select the search menu item. If using a tablet or phone, tap (or double tap) lightly when using the Genome Data Viewer), and scroll using the edges of your screen.
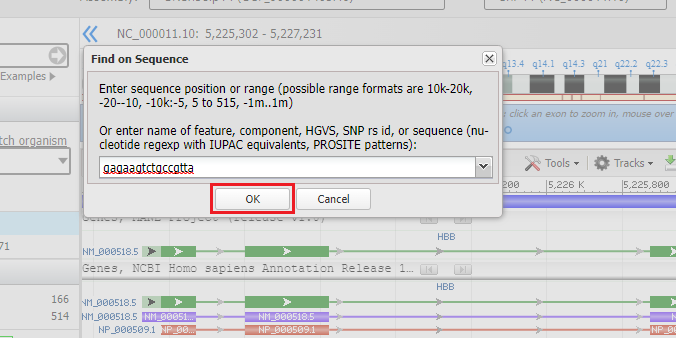
10. Paste the sequence that you copied earlier (gagaagtctgccgtta) and then click the OK button. An animated circle will appear on the Sequence tab as the sequence is searched.
11. It may take awhile, but eventually a green checkmark will appear next to the Sequence tab indicating that the sequence has been found. After the green checkmark appears, click the Sequence tab. If no checkmark appears, then you may not have pasted the correct sequence into the field, so try again.
12. The search sequence will appear, with numbers indicating where on the chromosome the sequence was found. Double-click on the line, then click the Close button.
13. The light green shaded area represents the region of the chromosome that matches the search sequence. The dark green lines represent the direction of the 5′ to 3′ orientation of the DNA molecule. If the arrows on the green lines are pointing to the left, use the Tools menu again and select Flip Strands, so that the arrows point to the right. This will make sure that the DNA sequences in the Genomic Data Viewer are in the same direction as the DNA sequences in the Case It simulation. If arrows are already pointing to the right, don’t use the Flip Strands feature.
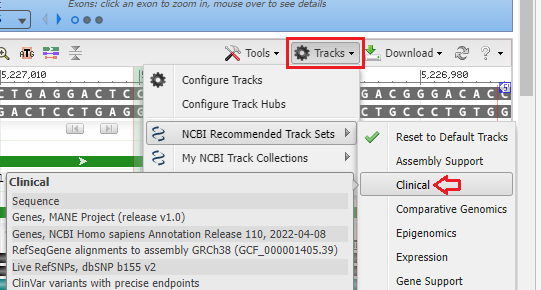
14. Click the Tracks button and select NCBI Recommended Track Sets and then select Clinical.
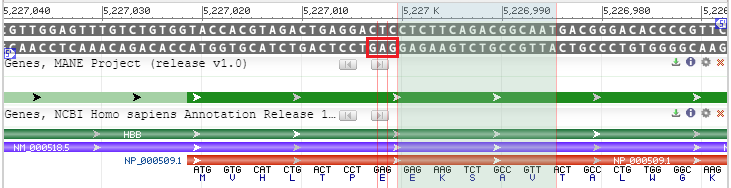
15. The DNA ladder is shown, with the lower strand in the 5′ to 3′ direction from left to right, and the upper strand being in the 5′ to 3′ direction from right to left (see blue 5′ labels on far right and left of the double-stranded DNA). The GAG on the lower strand (just to the left of the green shaded area, in red box) represents the codon affected by the sickle-cell mutation. The purple line represents mRNA, and the red line represents protein. Note that GAG encodes for glutamic acid (E). If the sickle-cell mutation had been present, the codon would be GTG, which codes for valine (V).
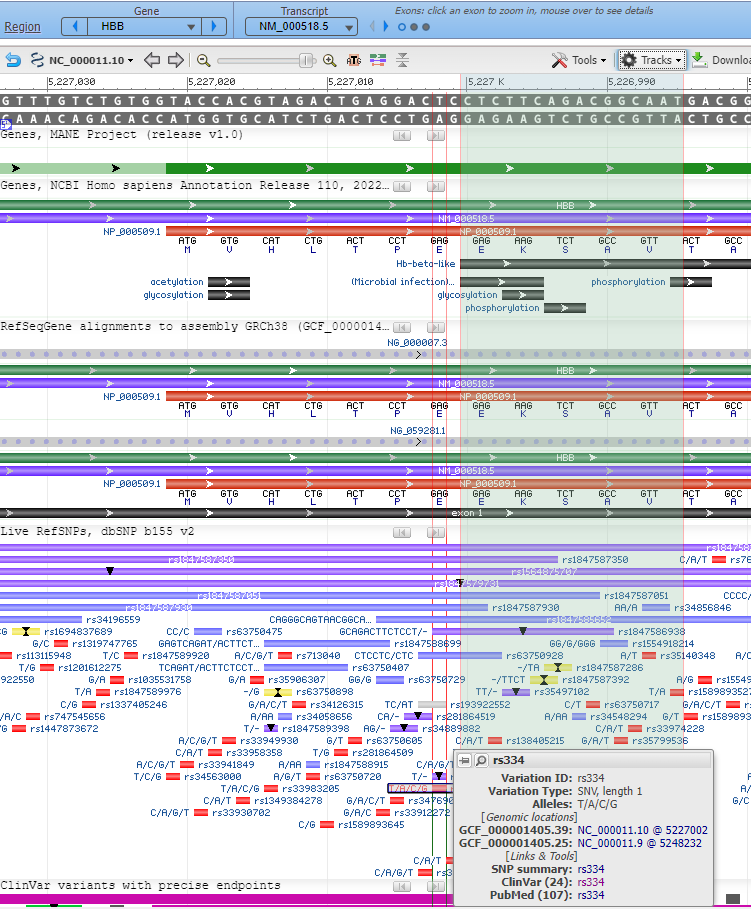
16. Expand your field of view to locate the small red box labeled rs334 and click on that box. Two thin red lines will appear showing that the box lines up with the GAG codon. Hovering over the red rs334 box (without clicking) will cause a pop-up box to appear with links to information about the rs334 SNP. For example, there are 107 publications in the PubMed database that reference this SNP, and 24 references in the ClinVar database. You can use the information to learn more about the sickle-cell mutation.
Note: It may be difficult to scroll down the page when using a tablet, because the track regions can be dragged to rearrange them. For example, with an iPad it will be necessary to slide your finger just off the screen to scroll down the page.
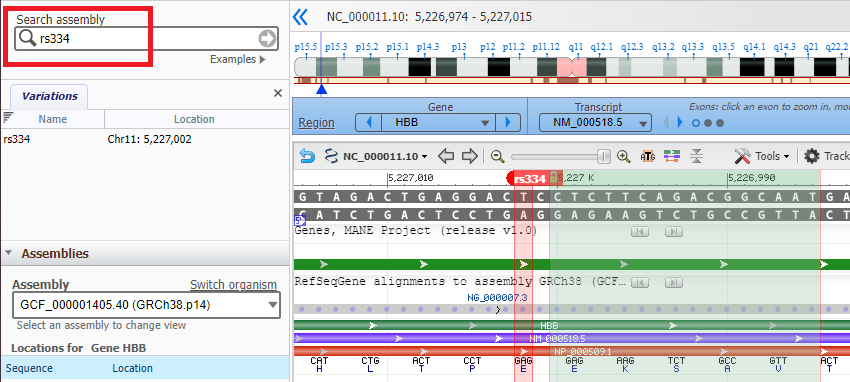
17. If you know the name of a SNP, you can locate it by typing its identifier into the Search assembly box as shown below. Note: This is case-sensitive, so use lowercase letters (rs334, not Rs334).
Goal of Steps18-22: To compare the 3D structure of wild type and mutated hemoglobin using the Protein Data Bank visualization tool. Links below will open the Protein Data Bank to entries on hemoglobin A (wild type) and hemoglobin S (containing the sickle-cell mutation). Videos show how to manipulate the three-dimensional structures so that the amino acid at position 6 of the beta subunit will be visible (glutamic acid for hemoglobin A, and valine for hemoglobin S).
18. Click here to read an overview of the function of hemoglobin, especially the section on ‘troubled hemoglobin’ and the videos on the ‘deoxy and oxy states of hemoglobin’.
19. Click here to open a page in the Protein Data Bank that shows the three-dimensional structure of ‘wild type’ hemoglobin A, then view this video. The video will show you how to select the ‘chain B’, one of the beta subunits, and will then show you how to magnify the protein sequence and move to the beginning of the sequence. Note that in this model, the two beta subunits are called ‘chain B’ and ‘chain D’, and the two alpha subunits are called ‘chain A’ and ‘chain C’. They are designated by different colors.
20. Click here to view a video that shows the four chains of ‘wild type’ hemoglobin A along with the amino acids at positions 5, 6 and 7 (proline, glutamic acid, glutamic acid). Click here to view a second video of hemoglobin A that gives a different view of the same amino acids. Note that when you hover over a location on the model, the name of the amino acid at that location appears in the lower right-hand corner of the diagram.
21. Click here to open a page in the Protein Data Bank that shows the three-dimensional structure of hemoglobin S, then select ‘chain B’, magnify the sequence, and move to the beginning of the sequence (as you did in Step 18 for hemoglobin A). After doing this, go through the exercise below and answer the question.
22. Exercise: Using the same techniques that you used for Step 20, examine the structure of hemoglobin S to see how it differs from hemoglobin A.
Question: How many differences are there between the two forms of hemoglobin? How can this account for the change in shape comparing normal cells to sickle-shaped cells?