Goal of this exercise: Analyze the first study that used the CRISPR-Cas9 system (CASGEVY) as a treatment for Sickle cell disease (Frangoul et al. 2021), and compare this with an alternate treatment (Risto-cel) that utilizes base editing (Gupta et al. 2026). Part 3 simulates the Risto-cell approach to treating the disease, by using Case It v705 to locate and edit BCL11A binding sites on the HBG1 and HBG2 promoters from Chromosome 11. BLAST and the Genome Data Viewer are then used to identify and visualize these binding sites.
Part 1: Overview of CRISPR-Cas9 and base editing treatments for Sickle cell disease.
Part 2: CRISPR-Cas9 exercise. Use Case It v705 to locate and cut the BCL11A erythroid-specific enhancer, then use BLAST and the Genome Data Viewer to visualize the enhancer.
Part 3: Base pair exercise (this page). Use Case It v705 to locate and edit BCL11A binding sites on the HBG1 and HBG2 promoters, then use BLAST and the Genome Data Viewer to identify and visualize binding sites in relation to gene location.
Organization of Part 3
Steps 1-9: Download Case It software and open the HBG1 + HBG2 gene sequence and the nCas9 enzyme file.
Steps 10-16: Use Case It v705 to locate and change base pairs on the gene sequence.
Steps 17-37: Use BLAST and the Genome Data Viewer to identify and visualize binding sites.
Questions/Exercises after Steps 6, 9, 16, and 37.
IMPORTANT! This exercise requires a revision of Case It v705 dated 07/21/26 or later. Check the About menu (upper left corner of screen) to make sure you are using the correct revision.
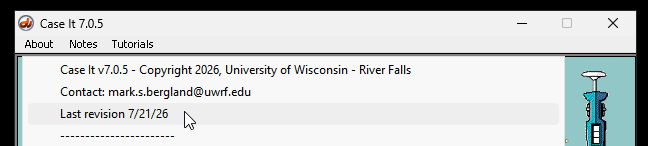
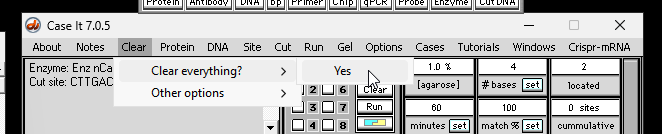
Step 1. If you do not have the revision of Case It v705 indicated above, download it using instructions available at the download page of the Case It web site. Double-click on the executable (Case It v705.exe), then click the button on the opening screen to begin. If this version is already open (see above), use the Clear menu at the top of the Data Screen and Clear Everything before beginning Part 3.
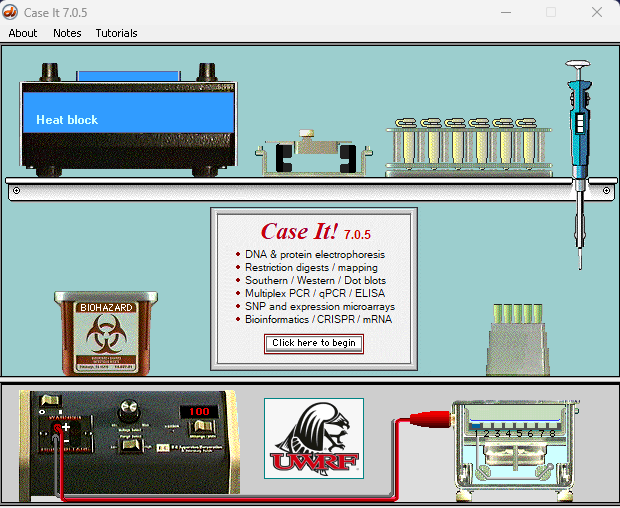
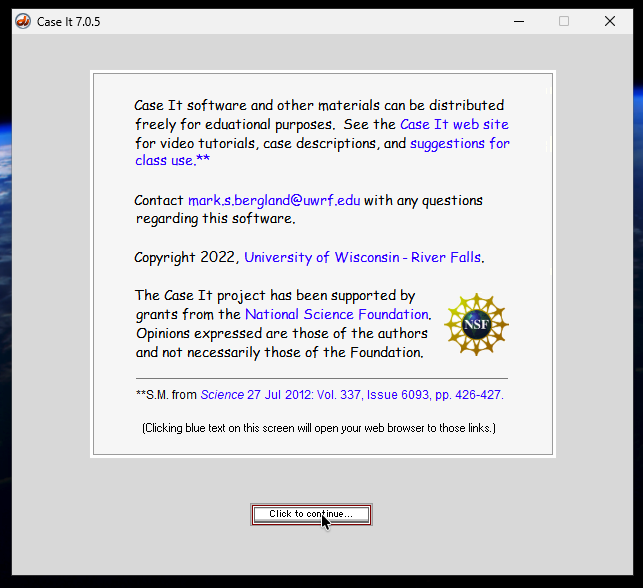
Step 2. Click the continue button on the second screen.
Step 3. Click the DNA button on the silver button bar.
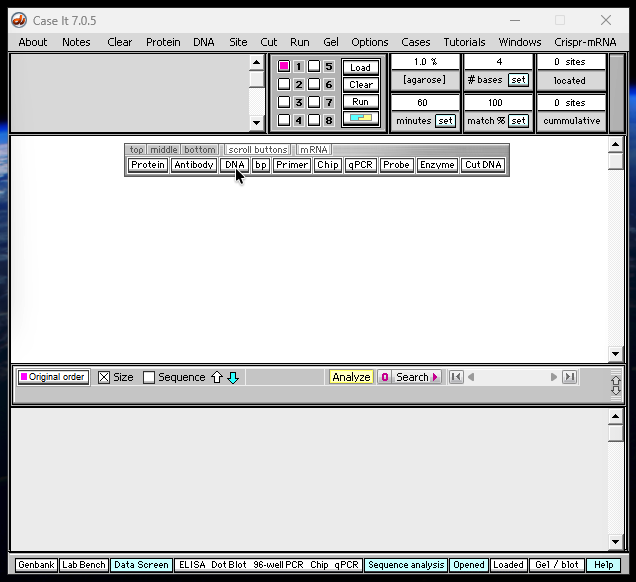
Step 4. Navigate to the Sickle cell base editing data folder that is inside the Case It v705 folder.
Note: If the Case It folder does not include the Sickle cell base editing data folder, go back to Step 1 and download the revision of Case It v705 dated 07/21/26 or later (If you do have this revision and don’t see the folder, use the horizontal or vertical dragbars to find it).
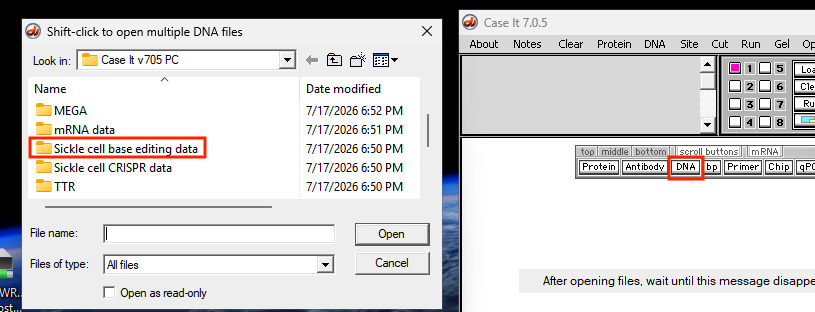
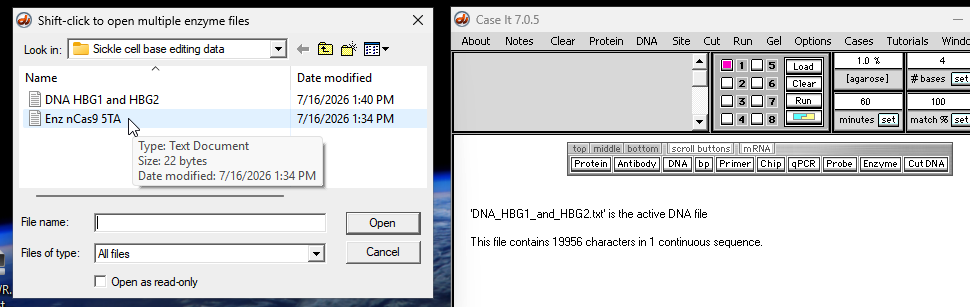
Step 5. Double-click on the file DNA HBG1 and HBG2.
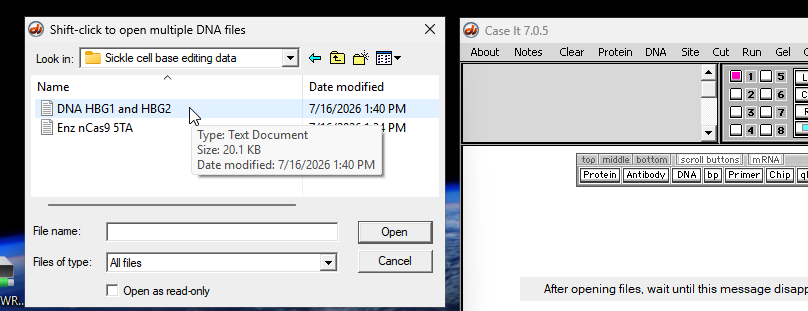
Step 6. Note that a line has appeared in the Opened & processed window showing the name of the DNA file, and that this file has 19556 characters in a single continuous sequence (see message in white field below). This represents a sequence that includes the HBG1 and HBG2 genes, located on chromosome 11 of the human genome.
Question: Why are there two genes for fetal hemoglobin, and what is the difference between them? What advantage does this give to the developing fetus?
Step 7. Click the Enzyme button on the silver button bar.
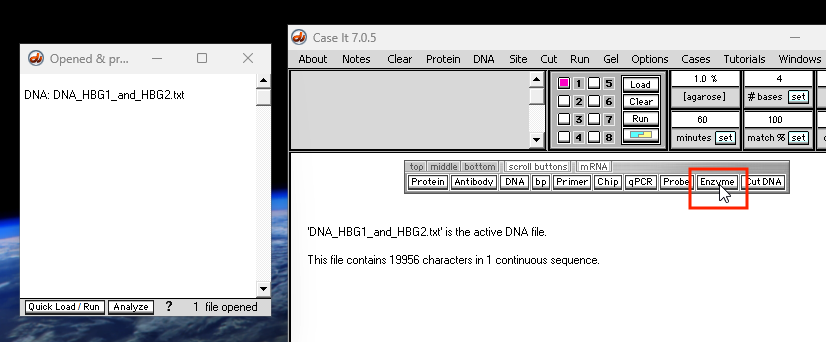
Step 8. Select the file Enz nCas9 5TA.
Step 9. Another line has appeared in the Opened & processed window showing the name of the opened file. That name also appears in the gray window at upper left of the Data Screen, along with the 20 bp sequence it contains.
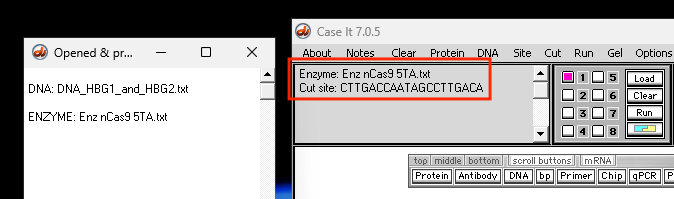
Questions: Why are there 20 characters in this sequence? What does the ‘n‘ in nCas9 stand for, and why is this critical for the process of base editing?
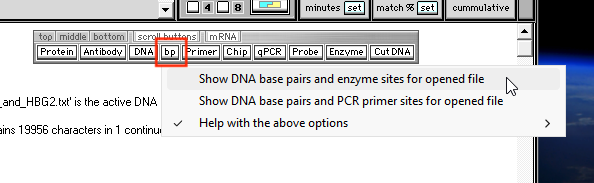
Step 10. Click the small bp button on the silver button bar (see cursor location below).
Step 11. The Base pairs window shows the first 60 base pairs in the double-stranded configuration, while the top (5′ to 3′) strand of the entire sequence is shown in the upper field. Click the green Find all sites button (bottom left corner of Base pairs window).
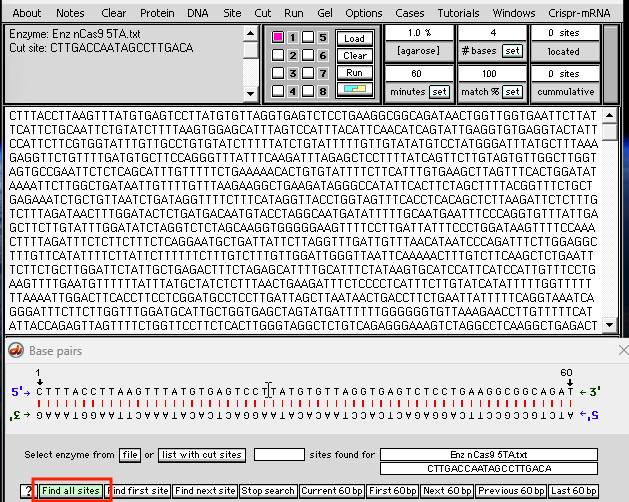
Step 12. The entire DNA sequence is searched and the last site found is shown, along with the starting and ending positions for this 60 bp sequence (10681 to 10740).
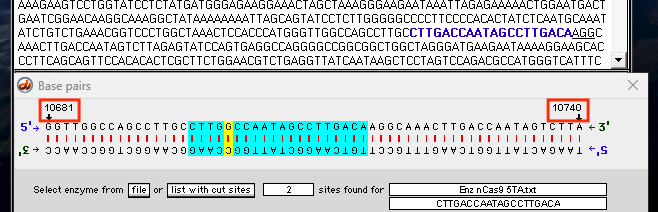
Step 13. To determine if more than one site was found, click the Find first site button.
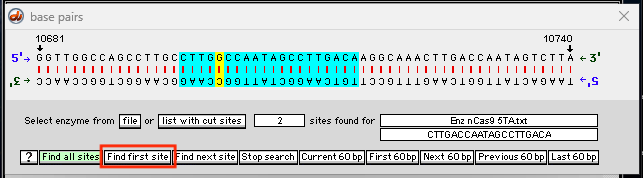
Step 14. A site is found earlier in the sequence, as you can tell by comparing the starting and ending positions below (5751 to 5820) with the starting and ending positions above (10681 to 10740).
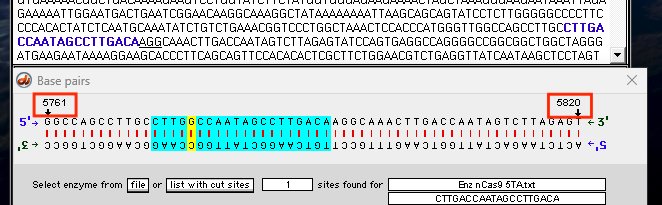
Step 15. To see if there are more than two sites present, click the Find next site button…
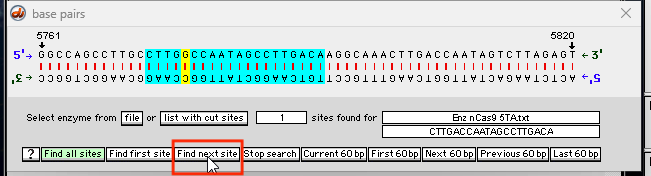
Step 16. …and the site found is the same as before (10681 to 10740 – see Step 12). This result confirms that there are only two sites on this DNA sequence that match the search sequence. To verify this, click the Find all sites button several times and carefully watch the starting and ending positions. Note that one of the base pairs changes color from blue to yellow, with a corresponding change in letters associated with that base pair (see sequential screen shots below). Repeatedly click the Find first site and Find next site buttons in sequence to see this same effect on both sites.
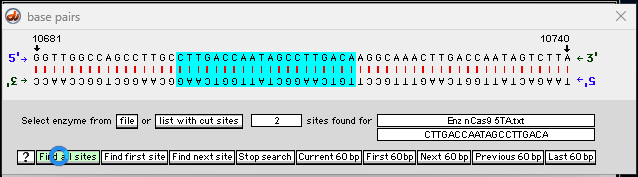
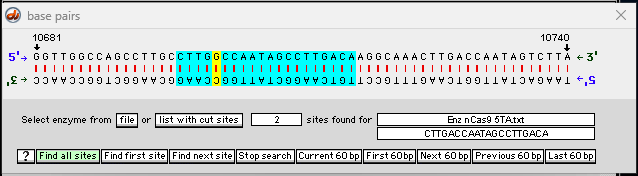
Questions: What is the significance of the change in base pairs at the location in yellow above? Is it the same change for both sites that were identified in this DNA sequence? When the change occurs, what biological process is the computer programming simulating? Why is this particular base pair the one selected for editing? Why are there two matches on this particular DNA sequence, and what does that tell you about the way that the HBG1 and HBG2 genes are expressed?
Exercise: Relate your answers to the process for using base editing as a treatment for Sickle cell disease. Why specifically is it considered potentially safer than the CRISPR Cas9 approach described in Parts 1 and 2?
After answering these questions, compare these results with Fig. 1 from Gupta et al. 2026, as shown in Part 1, and note that the representation of the DNA sequence from that figure is upside down compared to the representation shown above. Compare the 5′ to 3′ orientations in both illustrations to verify that they represent the same sequence.
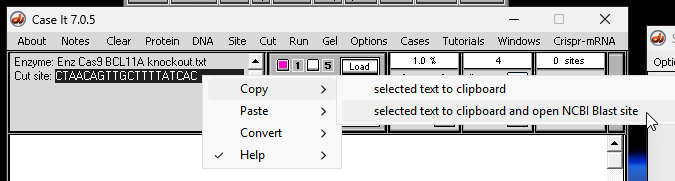
Step 17. The next series of steps will examine the HBG1 and HBG2 genes in more detail, using BLAST and the Genome Data Viewer. To begin this process, double-click on the search sequence to highlight it (upper left hand corner of the main screen), then right-click on the highlighted sequence and select Copy-> selected text to clipboard and open NCBI Blast site.
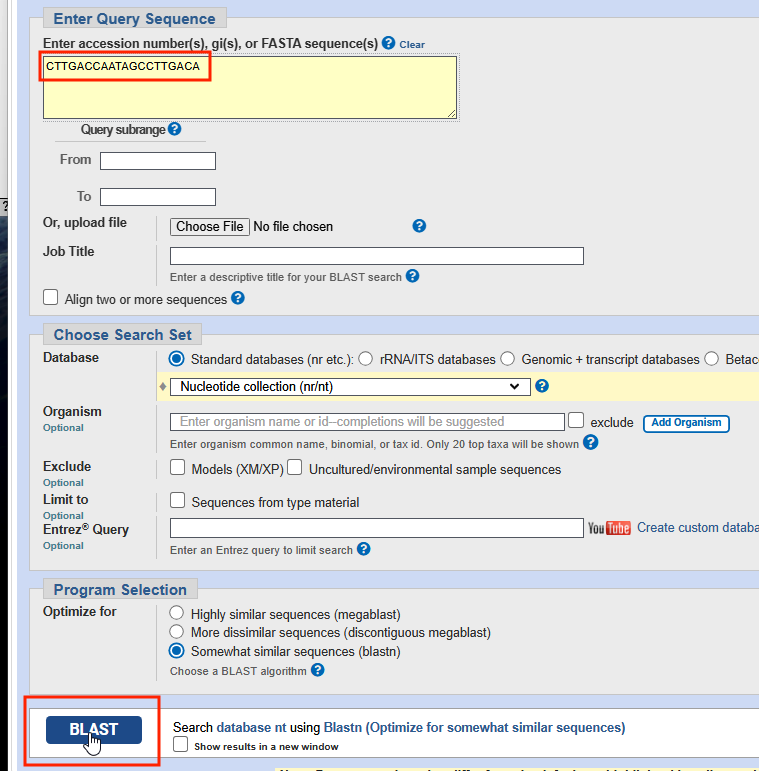
Step 18. Your web browser will automatically open to the NCBI BLAST site. Right-click and paste the search sequence into the BLAST search field, then look further down on the screen and click the BLAST button (don’t change the default settings before doing so).
Step 19. After a short time the BLAST results will appear. Note that two of the results refer to HBG2 and HBG1. Click on the link for the upper one (HBG2).
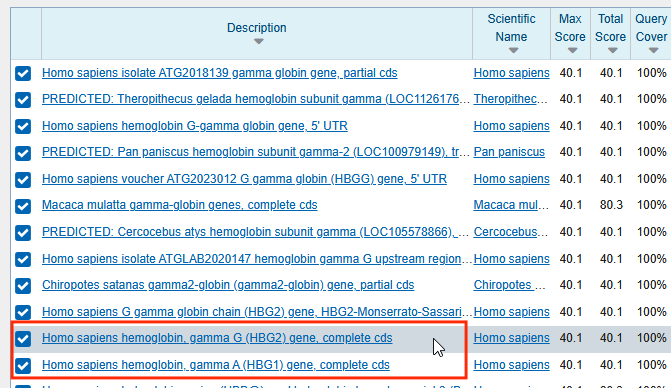
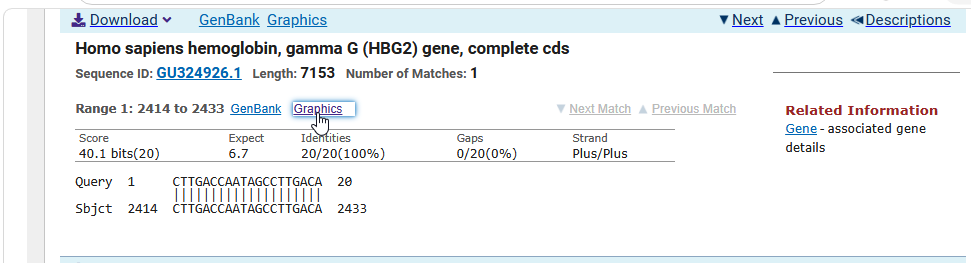
Step 20. Another screen will appear showing the Query (your search sequence) and the match on a sequence associated with the HBG2 gene (Sbjct, for ‘Subject’). Click the Graphics link as shown below.
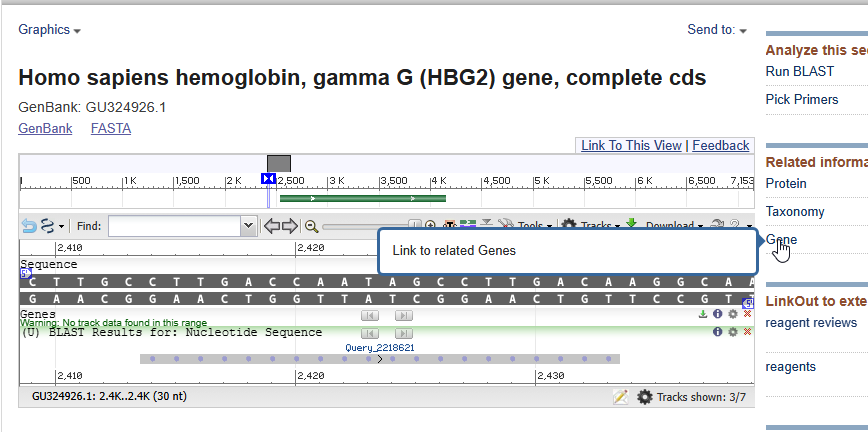
Step 21. Click Gene under Related information, right side of page.
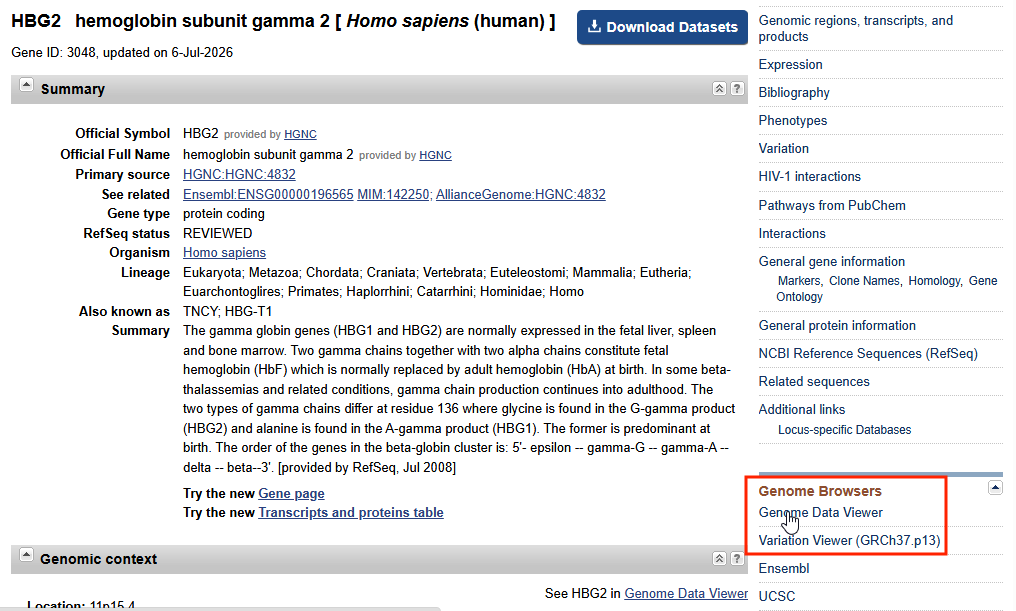
Step 22. Information on the HBG2 gene will appear. To view the gene on the Genome Data Viewer, click that link in the red box below.
Step 23. The HBG2 gene appears, showing that it is on Chromosome 11 (lower left). Green lines designate the DNA sequence, with exons shown as the thicker portions and introns as the thinner portions of the green lines.
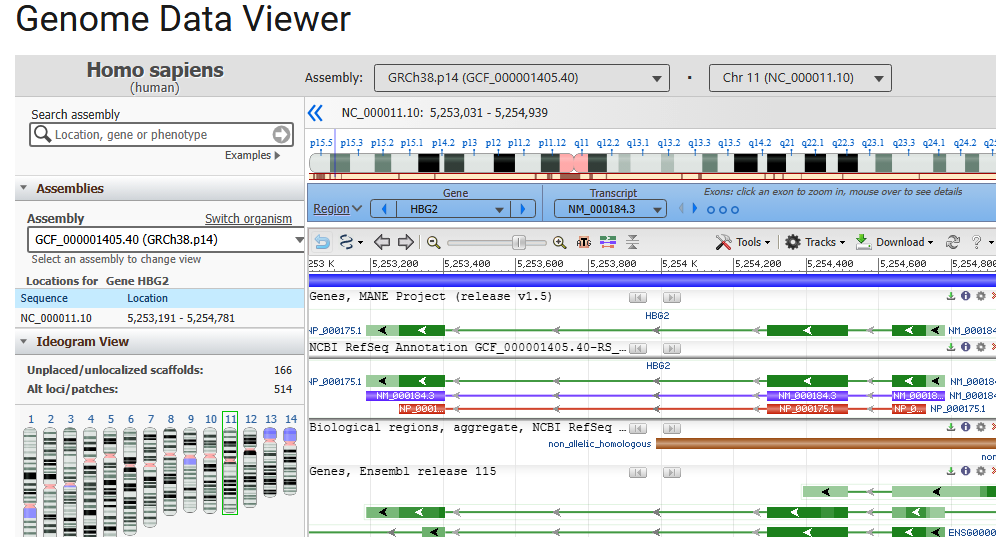
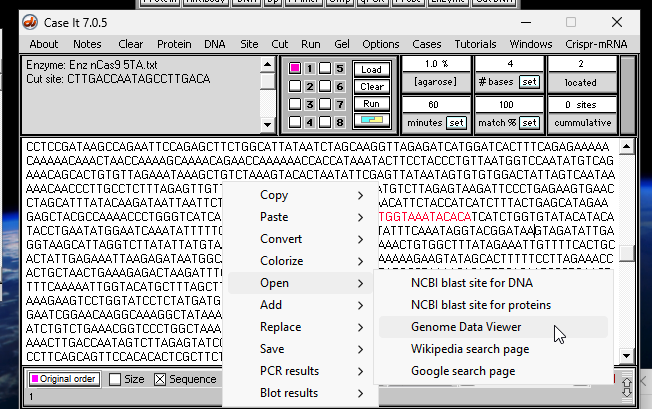
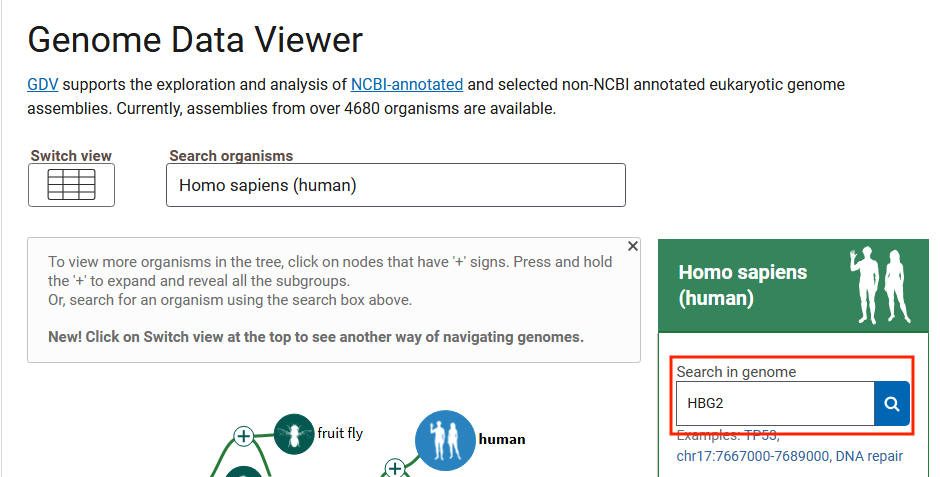
Note: Steps 17-23 showed an indirect method for viewing HBG2 on the Genome Data Viewer (as a way of demonstrating BLAST and some other features of the NCBI site). A more direct method is to right-click on the large field of Case It v705 and select Open -> Genome Data Viewer. Enter the gene name and click the magnifying glass icon, and you will be taken directly to the same gene location as shown above.
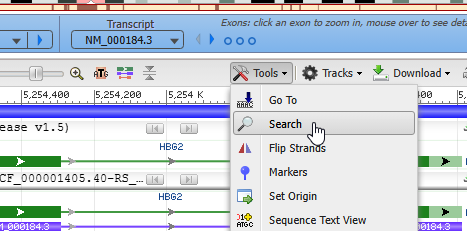
Step 24. Click on the Tools button and select Flip Strands (see note below). This is necessary in order for the following search procedure to work.
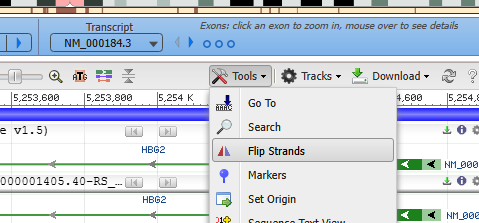
Note: Arrows pointing right (->) indicate that the gene is located on the plus (forward) strand of the DNA. Transcription proceeds from the 5′ end to the 3′ end in this left-to-right direction. Arrows pointing left (<-) indicate that the gene is located on the minus (reverse) strand of the DNA. Transcription also proceeds from 5′ to 3′, but reads right-to-left relative to the screen.
Step 25. Click the Tools button again and this time select Search.
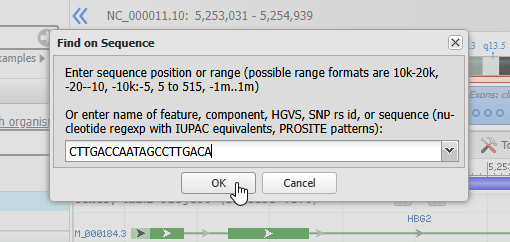
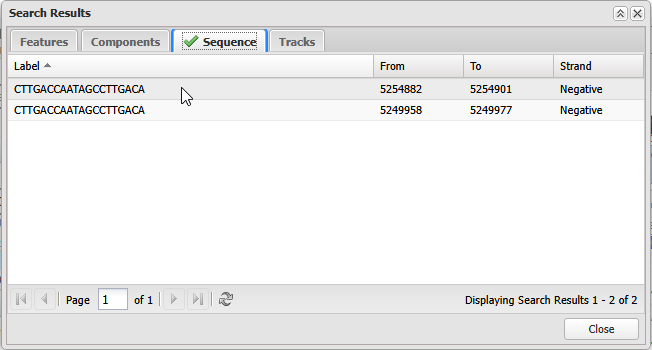
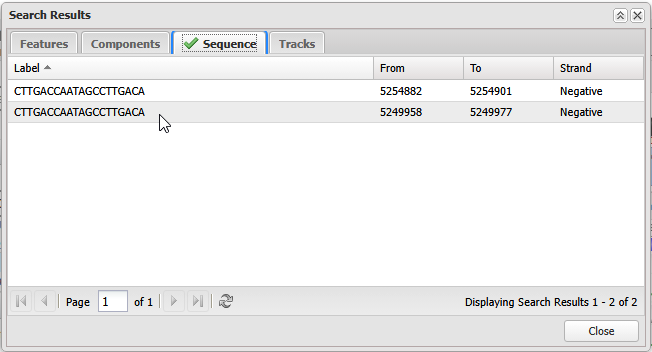
Step 26. The search sequence should still be on your computer’s clipboard, so paste it into the search box. If not, here is the sequence that you can copy and paste: CTTGACCAATAGCCTTGACA. After pasting the sequence, click OK.
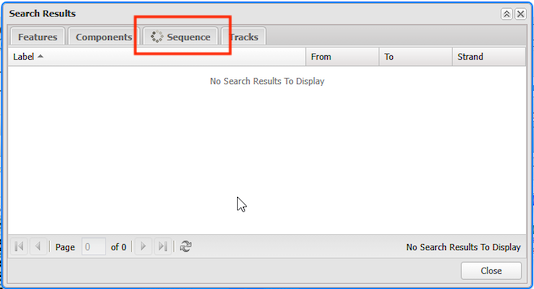
Step 27. A spinning icon on the Sequence tab will appear as the sequence is searched. If one or more sites are found, a green arrow will take the place of the spinning icon (second graphic below). If no green arrow appears in place of the spinning icon, (1) go back to Step 24 and make sure you flipped the strands so that the arrows point from left to right, and (2) make sure that the search sequence you entered exactly matches the one shown above.
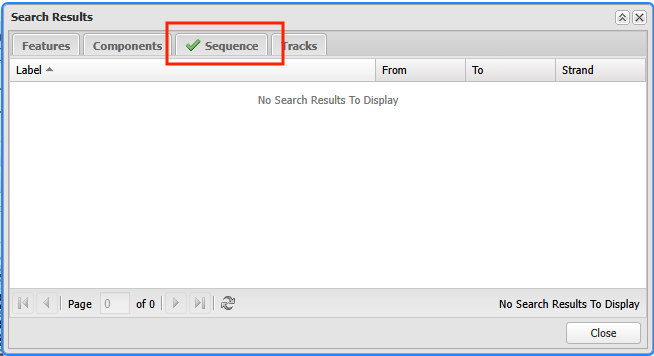
Step 28. Click on the green Sequence arrow, then double-click on the first search result. Then close the window by either clicking the X at upper right or the Close button at lower left.
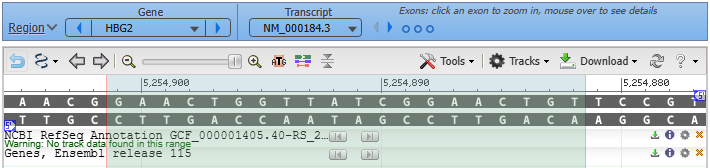
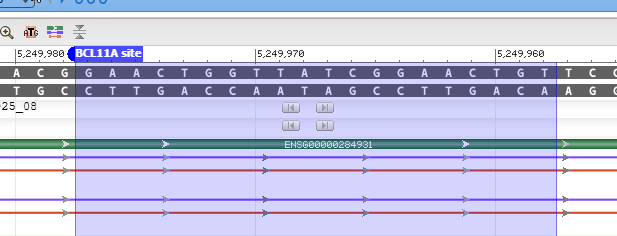
Step 29. The first search location appears, fully magnified to reveal the double-stranded configuration.
Note that the top strand has a 5′ symbol (in blue) on the far right, and the bottom strand has a 5′ symbol on the far left. Both the HBG1 and HBG2 genes are transcribed on the reverse (minus) strand of Chromosome 11. This is the bottom strand in the image below.
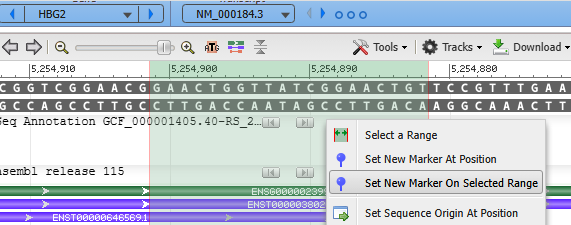
Step 30. To mark this region, right-click in the green area and select Set New Marker On Selected Range.
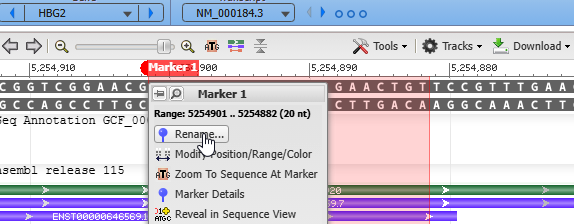
Step 31. The green region will change color (red in this case, but yours may be a different color). Hover your mouse over the Marker 1 label and a menu will appear. Select Rename, and name it BCL11A site (second image below).
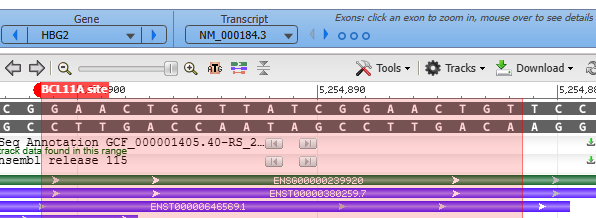
Step 32. Click the tab shown below to Collapse the sidebar to give more room for the gene sequences.
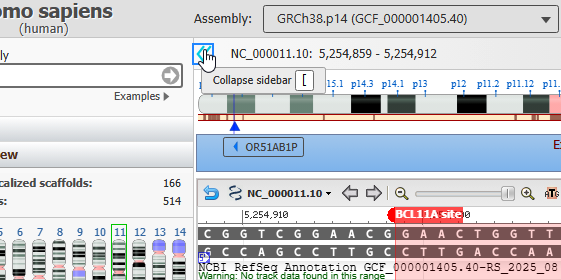
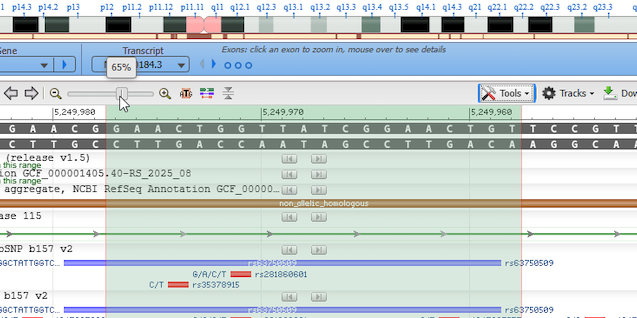
Step 33. Drag the slidebar to 65% to zoom out.
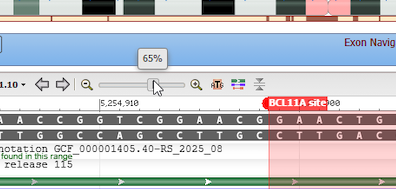
Step 34. Drag horizontally within a track to position the HBG1 and HBG2 genes so that they are both visible. You can also drag tracks vertically, out of the way to fully expose those two genes. If an area of the screen is draggable, the mouse cursor will change into the cross-shaped cursor shown in the red box below. Note that the HBG2 gene is on the left, and the HBG1 gene on the right, with the sequence identifier numbers increasing from right to left (click image to make it easier to read).
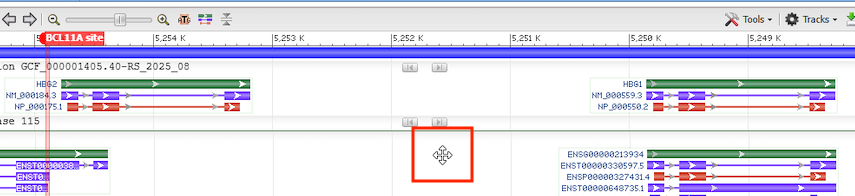
Step 35. Use the Tools menu and search for the same sequence, using the same procedure as in Steps 25-28, only this time double-click on the second search result, and that region will appear as shown in the second image below.
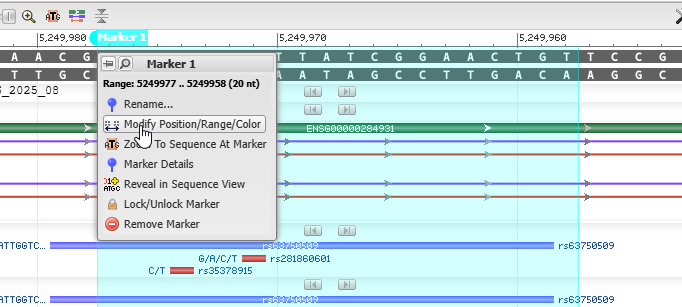
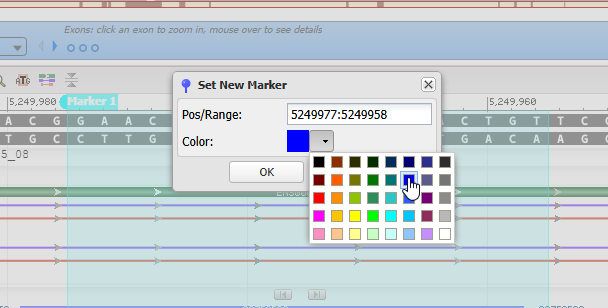
Step 36. Use the same procedure that was used in Step 30 to label this region, using a different color than you did before. If the default color that appears is too light, change it to a darker color using the Modify Poition/Range/Color menu option, then use the Rename feature (Step 31) to name it BCL11A site (third image below).
Step 37. Use the same procedure used in Steps 33-34 to zoom out to 65% and drag so that both genes are visible (click image to make it easier to read).

Questions: What can you deduce about the function of the marked locations above, in relation to HBG1 and HBG2 gene function? Why did we label both locations “BCL11A site”, and how does this relate to normal human development from fetus to adult? Other than their location on Chromosome 11, why are these two genes so similar in overall appearance?
Exercise: Relate your answers to results generated by Case It v705 when searching this same sequence (Steps 13-16), and to the questions posed after Step 16. (Note that the DNA strands displayed by Case it v705 are upside-down compared to the way that the Genome Data Viewer displays them. Strands can be shown in either configuration, as long as the 5′ and 3′ ends are labelled correctly.)
Part 1: Overview of CRISPR-Cas9 and base editing treatments for Sickle cell disease.
Part 2: CRISPR-Cas9 exercise. Use Case It v705 to locate and cut the BCL11A erythroid-specific enhancer, then use BLAST and the Genome Data Viewer to visualize the enhancer.
Part 3: Base pair exercise (this page). Use Case It v705 to locate and edit BCL11A binding sites on the HBG1 and HBG2 promoters, then use BLAST and the Genome Data Viewer to identify and visualize binding sites in relation to gene location.