Goal of this exercise: Use Case It v7.0.4 to recreate and analyze experiments that first demonstrated the function of Cas9, an enzyme that plays a fundamental role in CRISPR applications such as gene editing. The experiments described are from Jinek et al. 2012 and its Supplement, organized into four parts. Part 2 covers experiments with mutations designed to determine which genes allow Cas9 to cut complementary and non-complementary strands of the target DNA site. An answer key for this exercise is available to instructors upon request (contact mark.s.bergland@uwrf.edu).
Part 1: Experiments on site-specific actions of Cas9
Part 2: Experiments with mutations to determine Cas9 gene function
Part 3: PAM requirements and the sensitivity of Cas9 to mismatch
Part 4: Experiments targeting GFP gene sequences
Organization of Part 2
Steps 1-11: Experiment with plasmid DNA (Fig 2 A of Jinek et al. 2012)
Steps 12-21: Experiment with oligonucleotide DNA (Fig 2 B)
Steps below include links to images of the Case It simulation. If images do not appear sharp, use the Control (or Command) keys in conjunction with the plus and minus keys to change image size. Informational notes and questions are included in blue and yellow boxes, with text in italics.
Case It v7.0.4 is required for this exercise, as earlier versions of the software do not have the features necessary to recreate these CRISPR experiments. Go through Part 1 before attempting Parts 2, 3 or 4 of the exercise, especially if you are unfamiliar with the basic operation of Case It software.
The goal of the first series of steps (1-11) is to determine which genes allow Cas9 to cut complementary versus non-complementary strands of the target site on plasmid DNA.
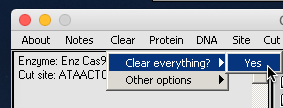
1. Set the program back to its default conditions:
–Click the Clear menu at the top of the data screen and select ‘Clear everything => Yes‘.
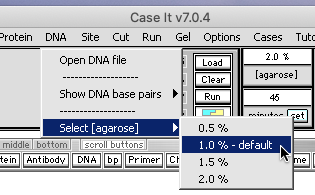
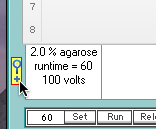
–Change the agarose concentration back to 1.0 percent.
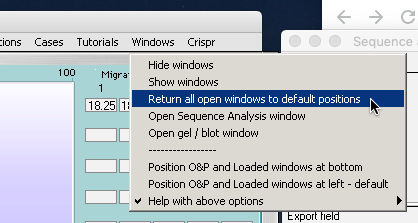
–Use the Windows menu to return windows to their default positions.
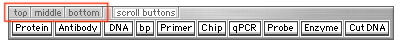
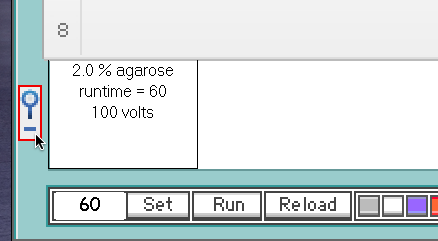
–Return the silver button bar to its middle position.
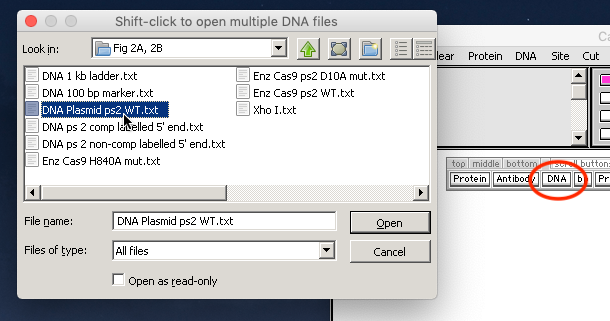
Then use the DNA button to open the file ‘DNA_Plasmid_ps2_WT.txt’ that is located inside the folder CRISPR data => Fig 2A, 2B.
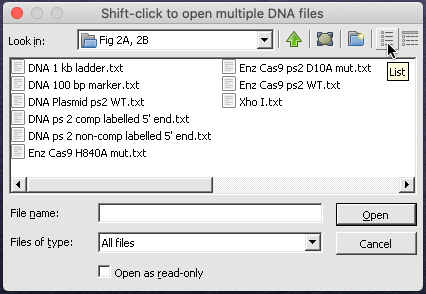
Note: If the the arrangement of files within the folder does not match that of the linked image in Step 1 above, click the List view button in the upper right-hand corner of the dialog box.
See the information under Step 2 of Part 1 more information about this plasmid file, including how to construct it from scratch as an optional exercise.
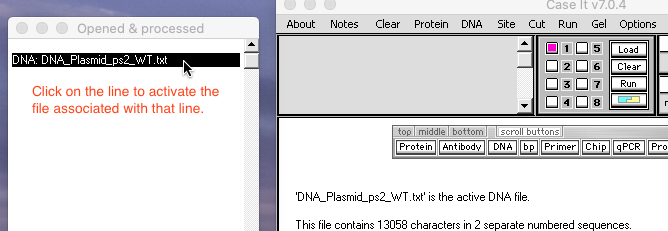
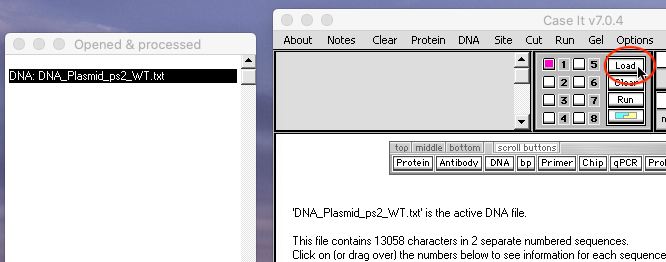
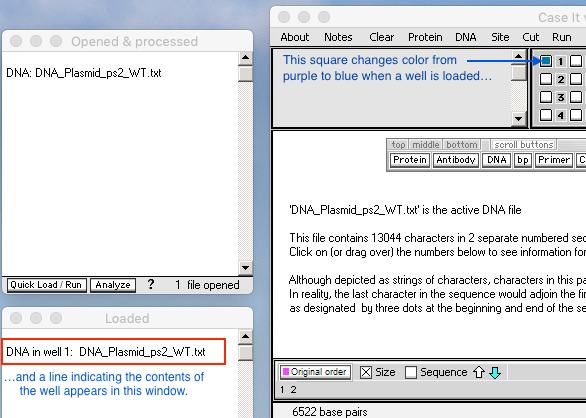
2. Click on the filename in the O&P window to activate, it then click the Load button to load the plasmid sequence into the first well. Note that the square associated with well 1 has changed color and the contents of the well appears as a line in the Loaded window.
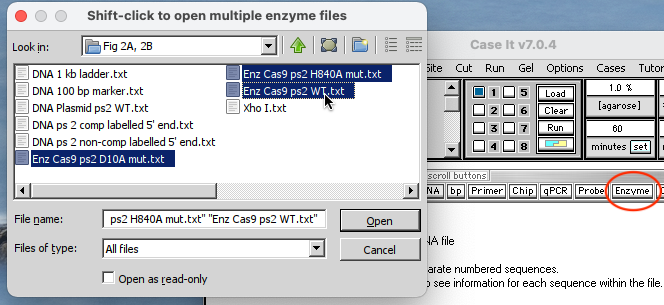
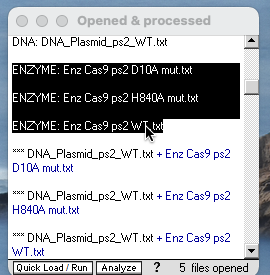
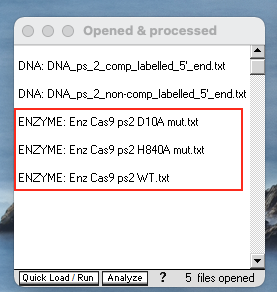
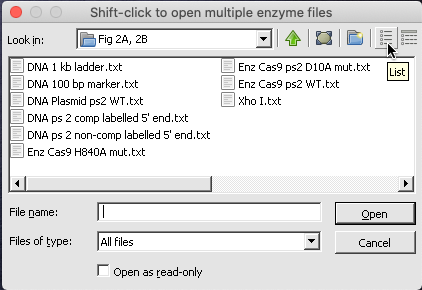
3. Use the Enzyme button to open the three enzyme files ‘Enz Cas9 ps2 D10A mut.txt’, ‘Enz Cas9 ps2 H840A mut.txt’,and ‘Enz Cas9 ps2 WT.txt’. (Recall from Part 1 that the shift-click technique is used to select multiple files, after which you can either double-click on them or click the Open button).
Note: These three files represent three versions of the Cas9 enzyme. H840A and D10A are mutations hypothesized to interfere with the ability of Cas9 to cut either the complementary or non-complementary strand of DNA. The ‘WT’ (wild type) enzyme does not have either of these mutations.
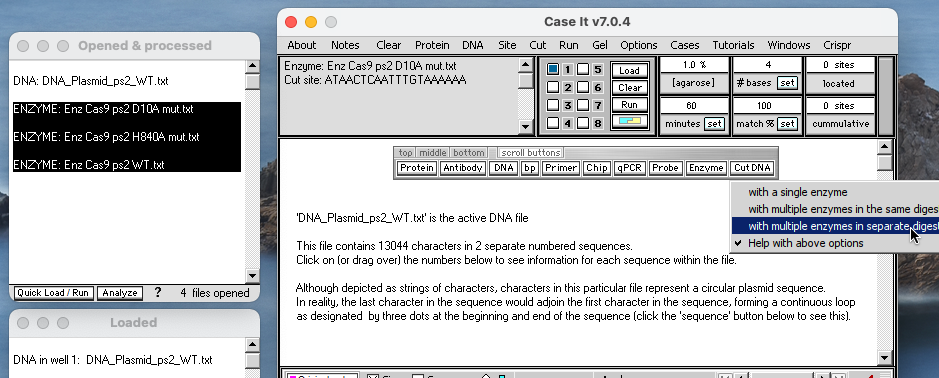
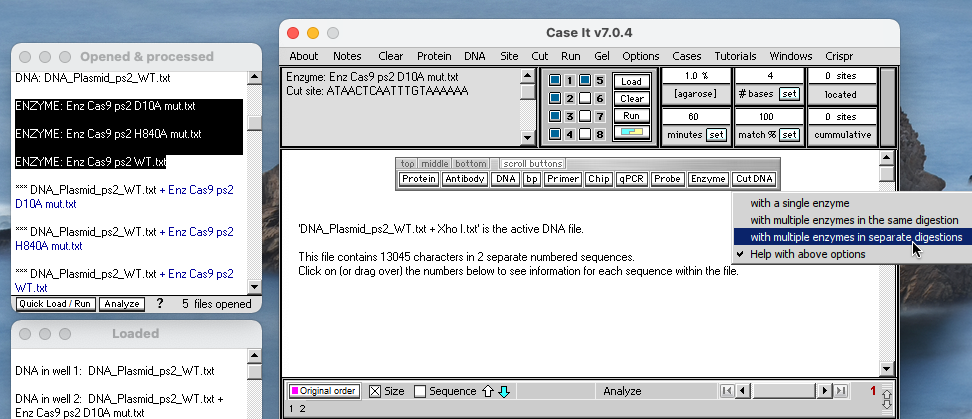
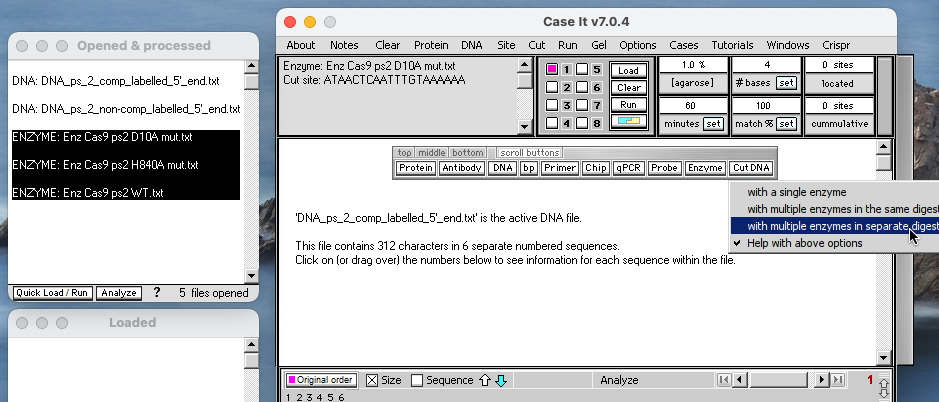
4. Shift-click to select the three enzymes, then click the Cut DNA button and select ‘with multiple enzymes in separate digestions‘ from the drop-down menu.
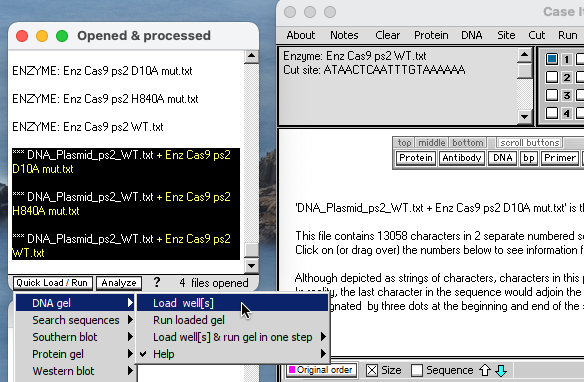
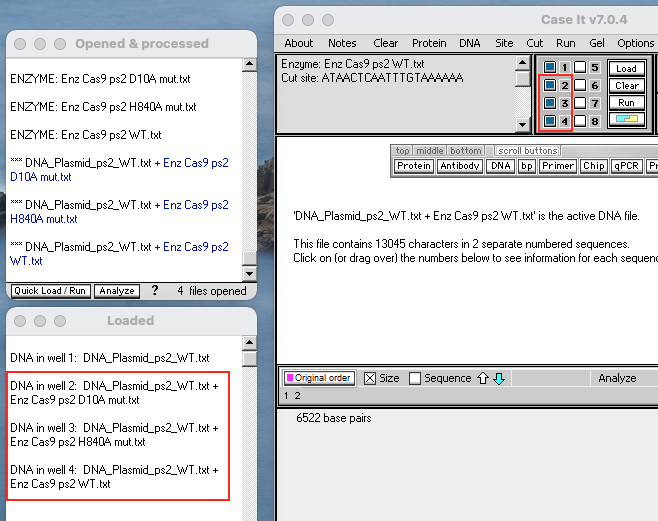
5. Three new lines appear with ‘***’ prefixes, indicating that these lines represent digested plasmid DNA. Shift-click to select these three lines, then click the Quick Load / Run button at the bottom of the Opened & processed (O&P) window and select ‘DNA gel’ => ‘Load well[s]’ from the drop-down menu. The three digested samples will be loaded into wells 2, 3 and 4, and three new lines appear in the Loaded window specifying the contents of those wells.
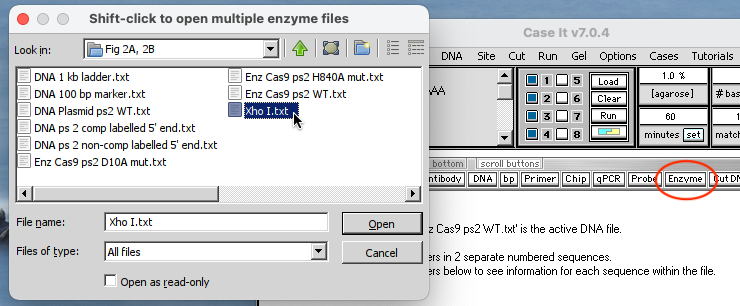
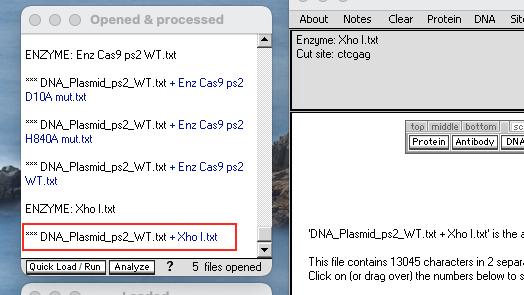
6. Use the Enzyme button to open the enzyme file ‘XhoI.txt’.
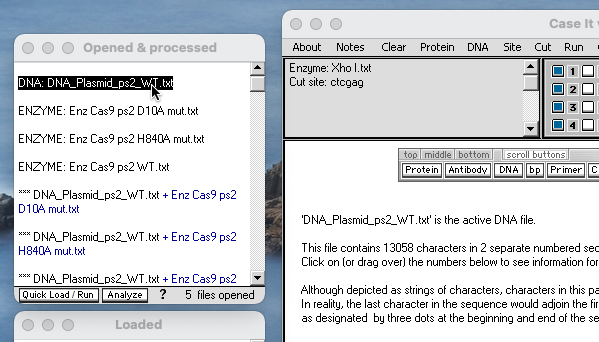
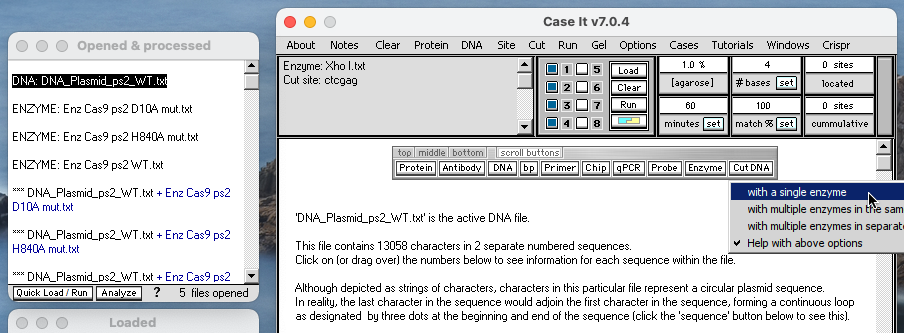
7. Scroll up to the top of the O&P window and click the first line (‘DNA: DNA_Plasmid_ps2_WT.txt’) to re-activate the wild-type plasmid containing protospacer 2. Then click the Cut DNA button and select ‘with a single enzyme’ from the drop-down menu. A new line with a ‘***’ prefix appears in the O&P window, representing the plasmid digested by Xhol.
Question: Why would you want to digest the wild-type plasmid with Xhol at this step in the experimental procedure?
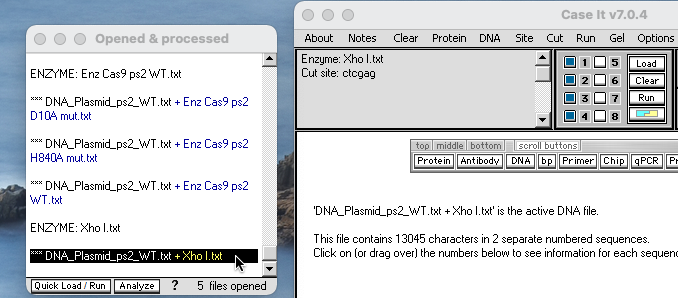
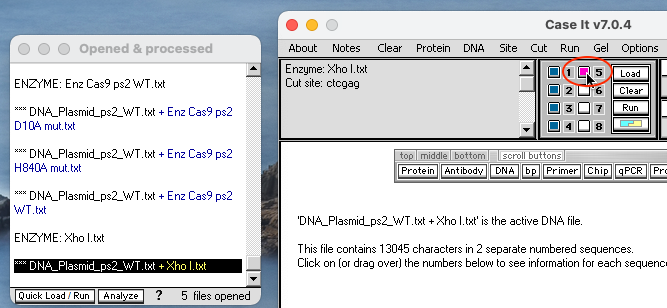
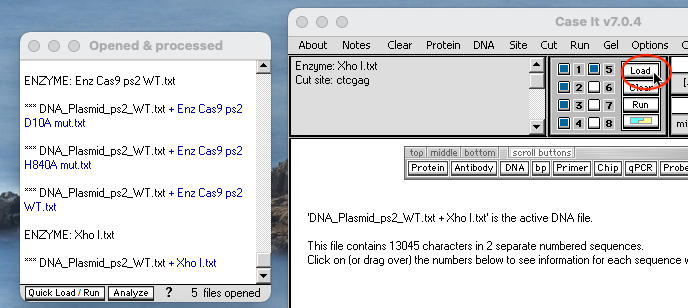
8. Load the digested plasmid (from Step 7) into well 5. To do this, first click that line in the O&P window, then click the white button to select well 5 for loading, and finally click the Load button. A new line will appear in the Loaded window indicating that the digested plasmid has been loaded into well 5.
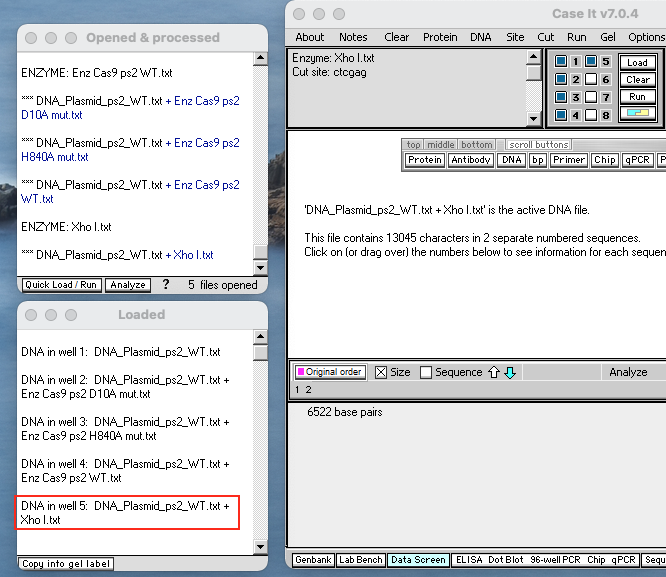
Note: As a reminder, always click on the line of interest in the O&P window before clicking the Load button. Files need to be ‘re-activated’ by clicking on them before they can be loaded into wells.
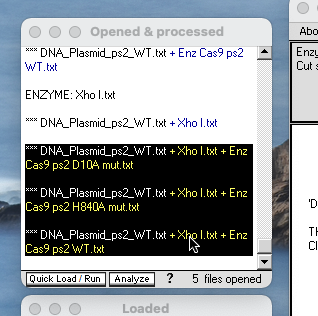
9. Click the last line in the O&P window again to activate the plasmid digested with XhoI. Scroll up to the top of the O&P window, shift-click to select the three Cas9 enzymes, then click the Cut DNA button and select ‘with multiple enzymes in separate digestions‘ from the drop-down menu. Three new lines appear, each representing the Xhol-digested plasmid digested by one of the three Cas9 enzymes.
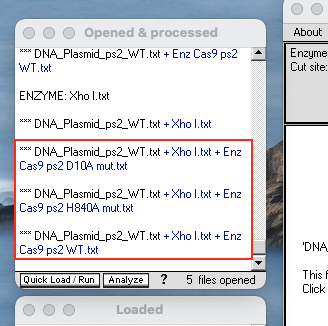
10. Shift-click to select the three lines (resulting from Step 9), then click the Quick Load / Run button and select ‘Load well[s] % run gel in one step => Show light fragments on dark background [UV photo]’ from the drop-down menu.
![Load well[s] % run gel in one step => Show light fragments on dark background [UV photo]’](https://www.caseitproject.org/wp-content/uploads/2021/06/Part-2-load-and-run-Xho-with-3-enzymes.png)
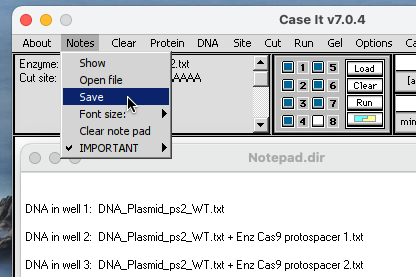
11. Save your results using one of the options in Step 15 of Part 1, also summarized in the blue box below.
*How to take screenshots:
On Windows computers, use either the Snipping Tool (or the newer Snip & Sketch) to capture portions of your screen. Open Snipping Tool, click ‘New’, and drag the screen to capture an image of the Loaded window (or the Notepad – see below) along with the gel. The image can then be saved in various formats, although .png is preferred.
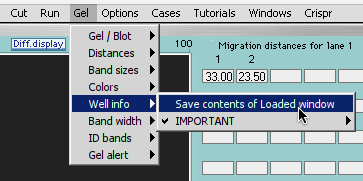
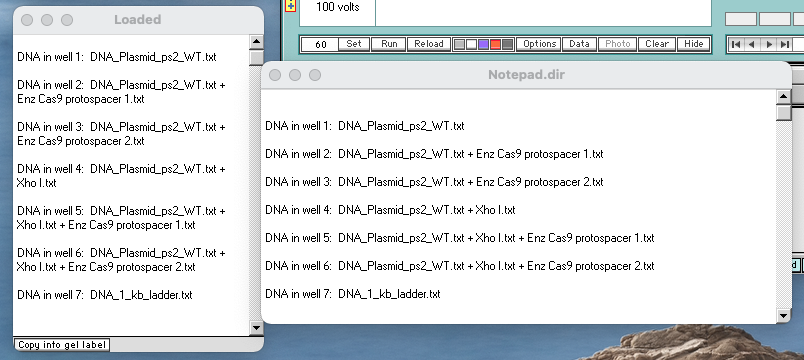
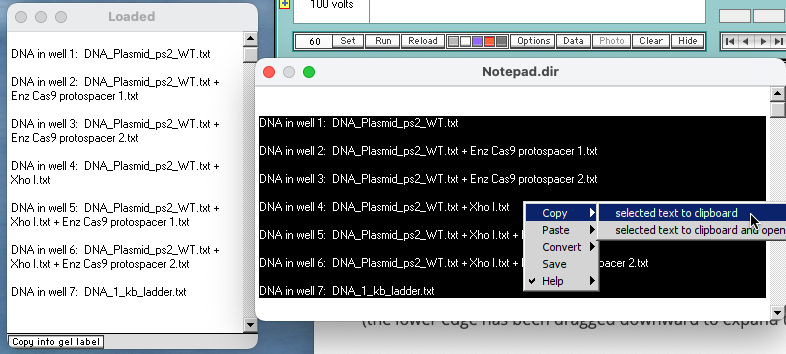
You can also use the Gel menu to copy the contents of the Loaded window to the Note Pad. From there, the information can be copied (via highlighting and right-clicking), saved (as a text file), or used in place of the Loaded window when you take a screenshot of the gel.
For the Mac, you can capture the screen using either Preview or the Screenshot application. To use Preview, select ‘Take Screenshot’ from the File menu. There are three options: From Selection, From Window, and From Entire Screen. The first option is the easiest way to capture an image of the Loaded window along with the gel. The image can then be saved as a .png file.
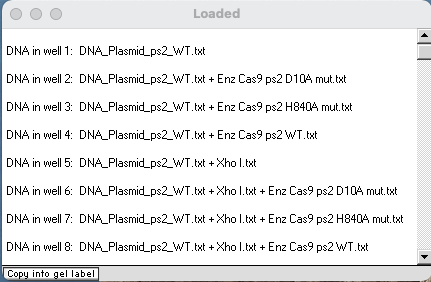
Your Loaded window should look like the one below. One of the lanes should just have the wild type (WT) plasmid, three should have the WT plasmid divided by one of the three Cas9 enzymes, one should have the WT plasmid digested just by Xhol, and three should have the WT plasmid divided first by Xhol, then by one of the three Cas9 enzymes.
Questions below assume that your gel has the same order of lanes as that shown below. If it does not, adjust the lane numbers accordingly as you answer the questions below.
Questions:
A. Which lanes on your gel correspond to the lanes in Fig 2A of Jinek et al. 2012? Why is it important to use controls for an experiment such as this, and which lanes are the controls?
B. Which of the lanes on your gel were used to test the effect of Cas9 (and mutated Cas9) on circular plasmids, and which were used to test these effects on linearized plasmids? Why would you want to use both types of plasmids for this experiment?
C. Compare the lane on the far left of Fig 2A with the lane that you loaded for the ‘wild type’ plasmid (lane 1 in the example above.) Why do these lanes have two bands? What is the difference between a ‘nicked’ (or open-circular) plasmid and a ‘supercoiled’ plasmid, and why do they move at different rates on a gel?
D. Compare the lanes shown for wells 2, 3 and 4 above with the comparable lanes in Fig 2A of Jinek et al. 2012. What does this tell you about the effect of the two mutations on Cas9 activity? Can you tell from these three lanes how the two mutations differ in their effect? What additional experiment would need to be run to determine this?
E. Examine the four lanes on your gel that involved digestion with XhoI (lanes 5-8 in the example above), and compare them with the four ‘linearized’ lanes on the right in Fig 2A of Jinek et al. 2012. Why are there two bands in the WT lane, whereas the other three lanes only have one band each?
F. Using the screen shot of the Loaded window above as a reference, compare lanes 2 and 3 with lanes 6 and 7. All four were exposed to the mutant forms of Cas9, yet the bands for lanes 2 and 3 did not travel as far as the bands for lanes 6 and 7. Why?
G. The band in lane 4 (not cut by Xhol) is in the same position as the bands in lanes 5, 6, and 7 (cut by Xhol). Why?
The goal of steps 12-21 is to examine effects of the above mutations using oligonucleotide rather than plasmid DNA (Fig 2B of Jinek et al. 2012).
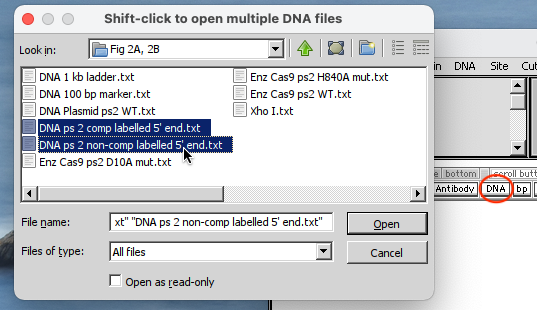
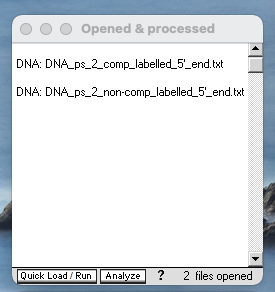
12. Use the Clear menu at the top of the data screen and select ‘Clear everything => Yes‘. Then open the two DNA files ‘DNA ps 2 comp labelled 5’end.txt’ and ‘DNA ps 2 non-compl labelled 5′ end.txt’. Two new lines appear in the Opened & processed (O&P) window.
Note: The first file represents an oligonucleotide with the complementary strand labelled on the 5′ end, and the second file represents an oligonucleotide with the non-complementary strand labelled on the 5′ end (see Fig 2E of Jinek et al. 2012). Both files contain the protospacer 2 sequence.
See note under Step 1 above for information on returning the silver button bar and other windows to their default positions.
13. Use the Enzyme button to open the three enzyme files ‘Enz Cas9 ps2 D10A mut.txt’, ‘Enz Cas9 ps2 H840A mut.txt’,and ‘Enz Cas9 ps2 WT.txt’. Three new lines appear in the O&P window.
Note: If the the arrangement of files within the folder does not match that of the linked image, click the List view button in the upper right-hand corner of the dialog box.
The first file represents Cas9 with the D10A mutation, the second file represents Cas9 with the H840A mutation, and the third file is the Wild Type (normal) Cas9 enzyme, all programmed to recognize the protospacer 2 sequence.
14. Click on the line ‘DNA: DNA_ps_2_comp_labelled_5’_end.txt‘ to activate that oligonucleotide file.
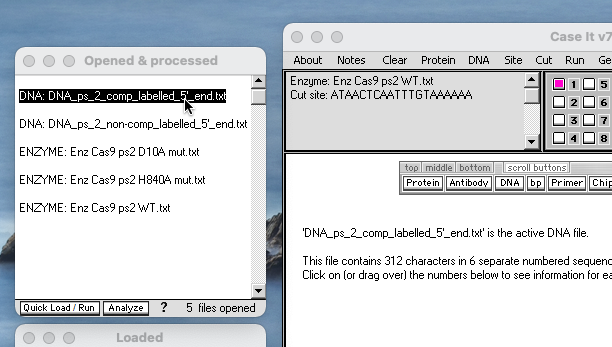
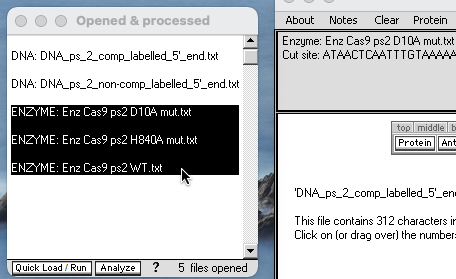
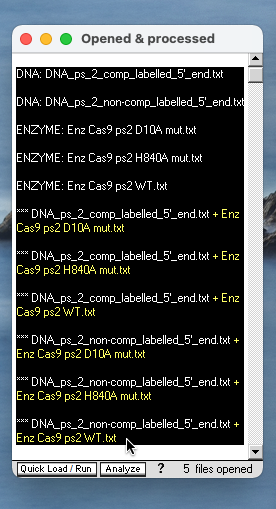
15. Shift-click to select the three enzymes opened in Step 13, then click the Cut DNA button and select ‘with multiple enzymes in separate digestions‘ from the drop-down menu. Three new lines with ‘***’ prefixes appear in the O&P window, representing the Cas9-digested oligonucleotide samples with the complementary sequence labelled on the 5′ end.
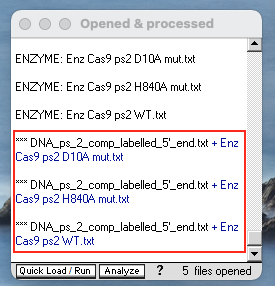
16. Scroll to the top of the O&P window, then click on the line ‘DNA_ps_2_non-comp_labelled_5’_end.txt‘ to activate that oligonucleotide file.
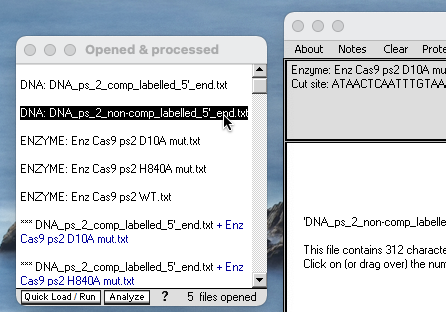
17. Shift-click to select the same three enzyme files opened in Step 13, then click the Cut DNA button and select ‘with multiple enzymes in separate digestions‘ from the drop-down menu. Three new lines with ‘***’ prefixes appear in the O&P window, representing the Cas9-digested oligonucleotide samples with the non-complementary sequence labelled on the 5′ end.
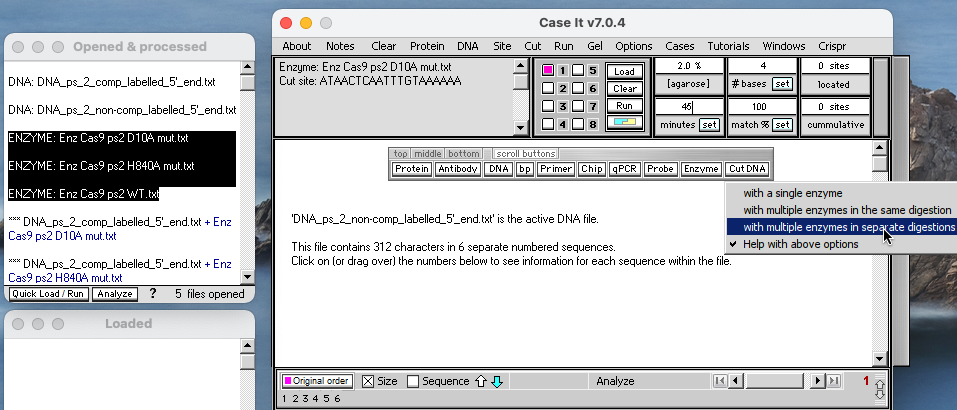
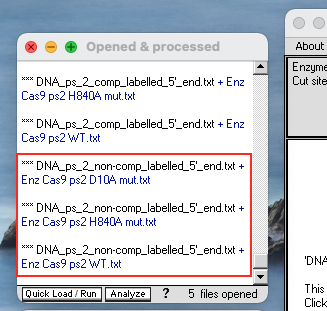
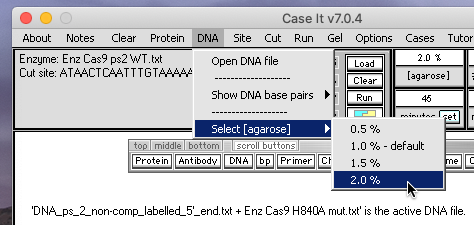
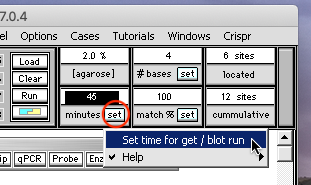
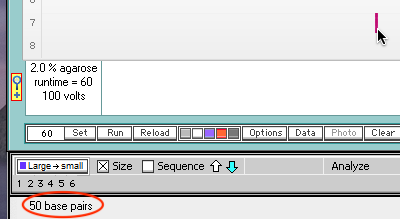
18. Use the DNA menu to change the agarose concentration to 2%, then change the timer setting from 60 to 45 minutes. To change the timer setting, double-click on the number 60 in the field to select it, type in the number 45, then click the Set button and select ‘Set time for gel/blot run’ from the drop-down menu.
Question: In Part 1 we used settings of 2% agarose and 60 minutes when running oligonucleotide sequences, but here we used a setting of 2% agarose but changed the timer setting from 60 to 45 minutes. Why would this be necessary?
19. Drag the lower edge of the O&P window down to make that window larger. Shift-click to select all lines in the O&P window, then click the Quick Load / Run button and select ‘DNA gel => Load well[s] and run gel in one step => Show only fragments radiolabelled at 5′ end‘ from the drop-down menu.
![DNA gel => Load well[s] and run gel in one step => Show only fragments radiolabelled at 5′ end](https://www.caseitproject.org/wp-content/uploads/2021/06/Part-2-run-all-oligos.png)
Note: It was possible to select all lines in the window because the three enzyme files will be automatically skipped over when the wells are loaded.
20. After the get is run, you can click on bands to determine their sizes (which appear in the field below the gel). The black fragment should turn red after it is clicked, and its size will be shown in the lower field of the Data Screen.
It may be necessary to hold the mouse button down for 1-2 seconds when clicking on bands, especially if you are using the Mac version of the software. So if you click on a band and it doesn’t turn red, wait a few seconds and try again, carefully positioning the cursor over the band of interest, then holding the mouse button down for 1-2 seconds. You may have to repeat this process several times to be successful.
If it is difficult to distinguish among bands, you can make the bands narrower by clicking the button on the right above the gel, and you can also magnify the gel (see note below). The original width can be restored by clicking the button on the left, or by clicking in any blank area of the gel. Although easier to distinguish between them, it is more difficult to click on narrower bands.
Note: It may also be helpful to magnify the gel by clicking the magnifying glass icon. Click the icon again to return the gel to its original size. If the magnified gel is dragged by its upper edge, it will automatically return to its original size, so you will have to click the icon again once the gel has been dragged to a new position.
21. Move the Loaded window to the left of the gel, drag the lower edge to show all of the information for the eight loaded wells, make a screen shot* of the Loaded window and gel, then and save it.
*See note under Step 11 for information on taking a screen shot of the gel.
Your Loaded window should look like the one below. Note that the order of loading is different from that of Fig 2B of Jinek et al. 2012. Taking this into consideration, compare your results to Fig 2B, then answer the questions below.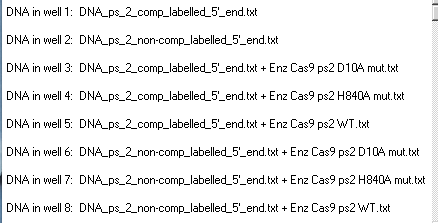
Questions:
A. What lanes on your gel represent controls for this experiment, and why are controls used in experiments such as this?
B. Based on the results of this experiment, which strand of the DNA molecule (complementary or non-complementary) is cleaved by the domain that was inactivated by the D10A mutation (RuvC), and which side is cleaved by the domain inactivated by the H840A mutation (HNH)? Explain your rationale.
Top of this page
Go back to Part 1: Experiments on site-specific actions of Cas9
Go to Part 3: PAM requirements and the sensitivity of Cas9 to mismatch
Go to Part 4: Experiments targeting GFP gene sequences