Goal of this exercise: Use Case It v7.0.4 to recreate and analyze experiments that first demonstrated the function of Cas9, an enzyme that plays a fundamental role in CRISPR applications such as gene editing. The experiments described are from Jinek et al. 2012 and its Supplement, organized into four parts. Part 3 covers three sets of experiments designed to determine how sensitive Cas9 is to changes in the PAM site adjacent to the recognition site of the enzyme. An answer key for this exercise is available to instructors upon request (contact mark.s.bergland@uwrf.edu).
Part 1: Experiments on site-specific actions of Cas9
Part 2: Experiments with mutations to determine Cas9 gene function
Part 3: PAM requirements and the sensitivity of Cas9 to mismatch
Part 4: Experiments targeting GFP gene sequences
Organization of Part 3
Steps 1-7: Effect of two mutations in the PAM sequence (Fig S13 B)
Steps 8-16: Effect of five additional PAM mutations (Fig S13 C)
Steps 17-26: Determination of sensitivity to mismatch in protospacer target site (Fig 3E)
Steps 27-40: Visualization of the double-stranded nature of enzyme recognition sites
Steps below include links to images of the Case It simulation. If images do not appear sharp, use the Control (or Command) keys in conjunction with the plus and minus keys to change image size. Informational notes and questions are included in blue and yellow boxes, with text in italics.
Case It v7.0.4 is required for this exercise, as earlier versions of the software do not have the features necessary to recreate these CRISPR experiments. Go through Part 1 before attempting Parts 2, 3 or 4 of the exercise, especially if you are unfamiliar with the basic operation of Case It software.
The following steps recreate Fig S13 B of the Supplement to Jinek et al. 2012. The goal is to determine the function of the PAM sequence by introducing mutations into this sequence and seeing what effect this might have on the ability of Cas9 to cut plasmid DNA.
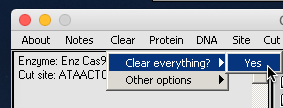
1. Set the program back to its default conditions:
–Click the Clear menu at the top of the data screen and select ‘Clear everything => Yes‘.
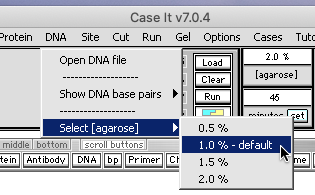
–Change the agarose concentration back to 1.0 percent.
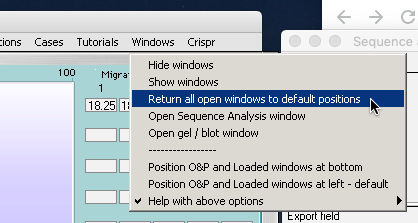
–Use the Windows menu to return windows to their default positions.
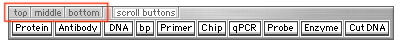
–Return the silver button bar to its middle position.
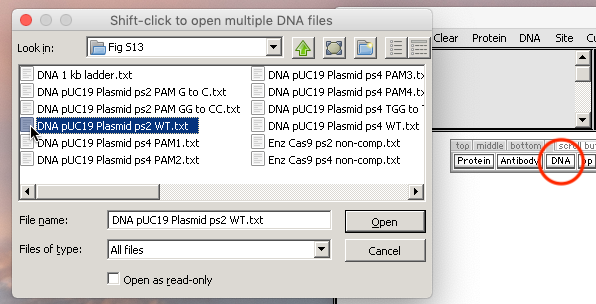
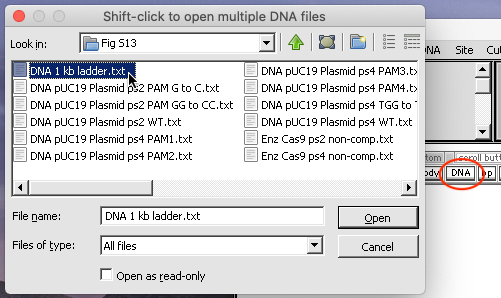
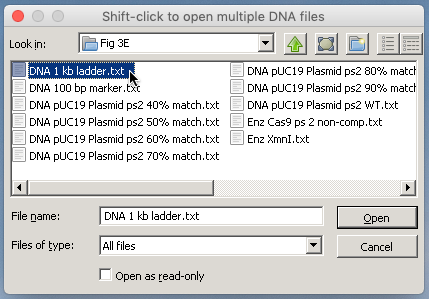
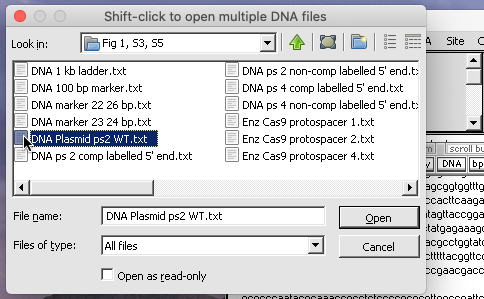
Then use the DNA button to open the file ‘DNA pUC19 Plasmid ps2 WT.txt‘ that is located inside the folder CRISPR data => Fig S13.
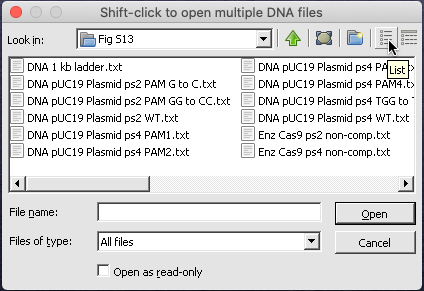
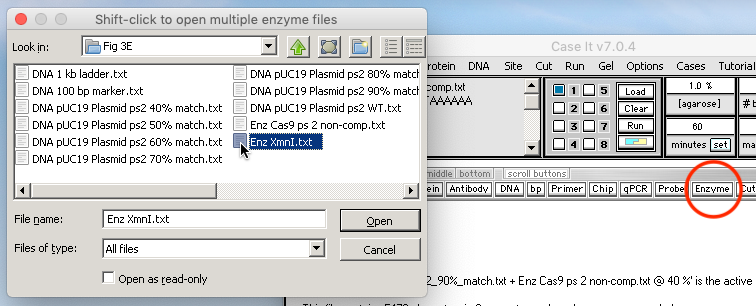
Note: If the the arrangement of files within the folder does not match that of the linked image in Step 1 above, click the List view button in the upper right-hand corner of the dialog box.
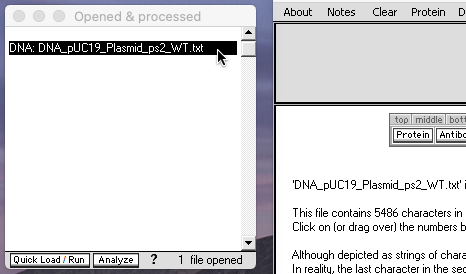
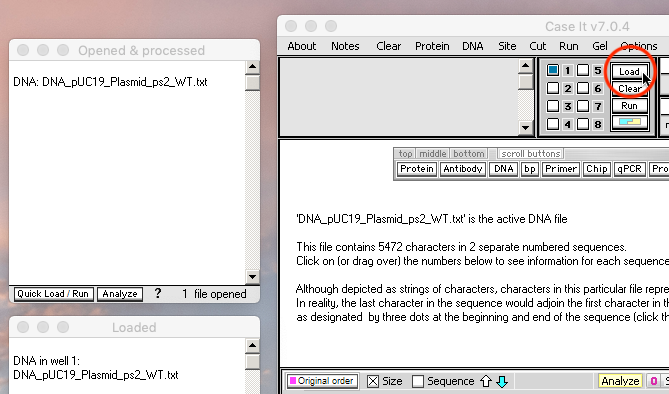
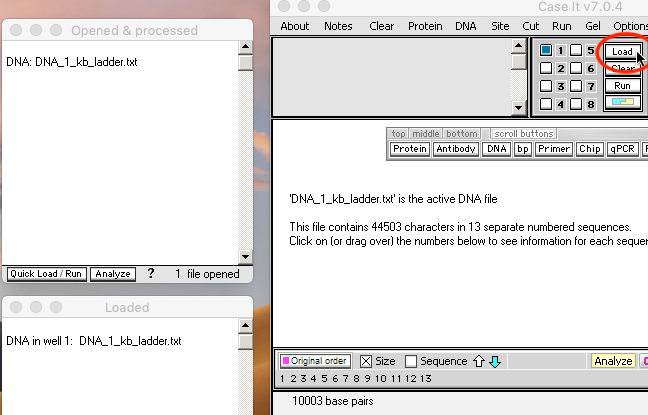
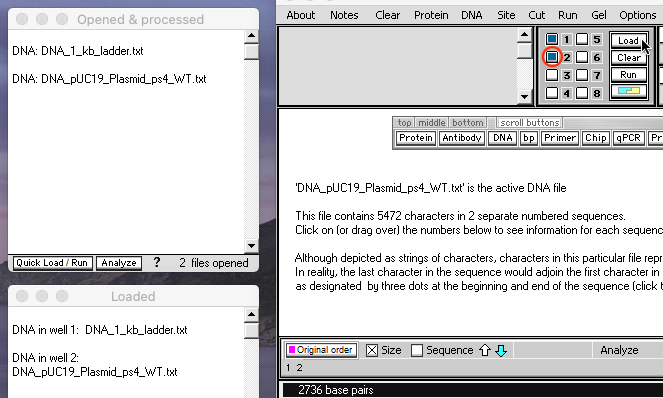
2. Click the line in the O&P window to activate the file for loading, then click the Load button to load the undigested plasmid into well one.
Question: Why would you want to load an undigested plasmid as part of this experiment?
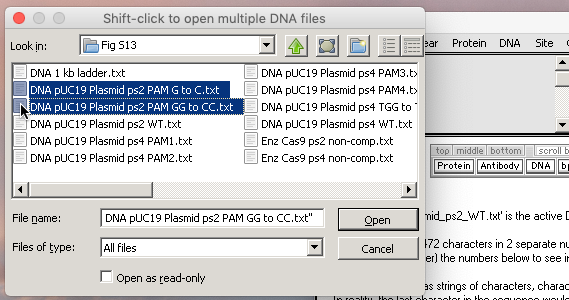
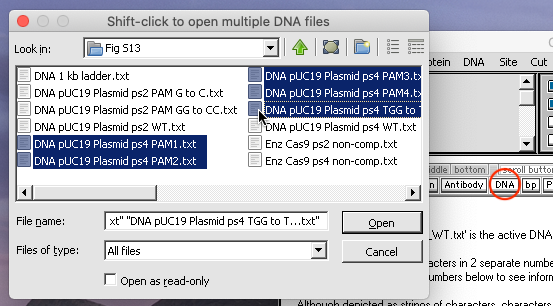
3. Click the DNA button on the silver button bar, shift-click to select the files ‘DNA pUC19 Plasmid ps2 PAM G to C.txt’ and ‘DNA pUC19 Plasmid ps2 PAM GG to CC.txt‘, and open them.
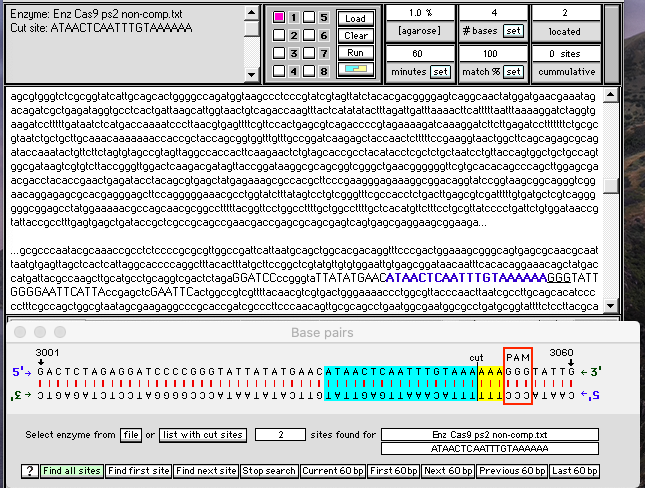
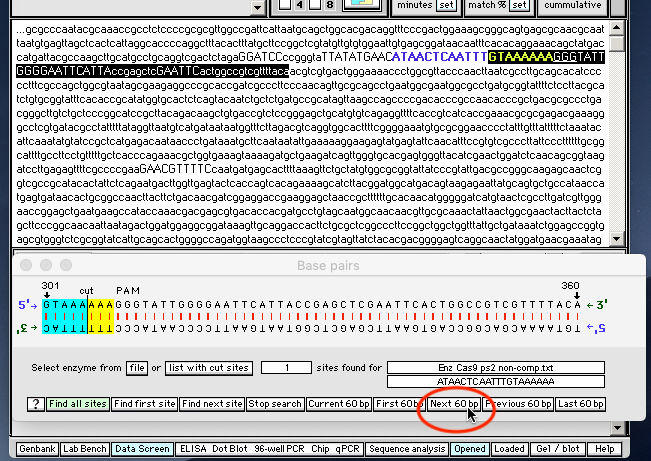
Note: Both of these two files have mutations in the PAM sequence; the first one GGG => GCG, and the second GGG => GCC. The plasmid consists of the pUC19 backbone to which the protospacer 2 sequence has been added (protospacer sequences are listed in Table S3 of the Supplement to Jinek et al. 2012).
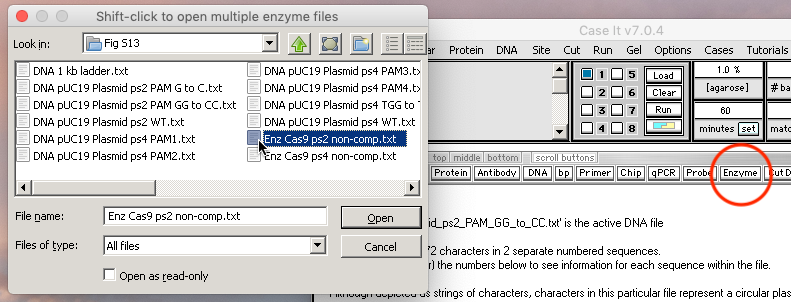
4. Click the Enzyme button on the silver button bar and open the file ‘Enz Cas9 ps2 non-comp.txt‘.
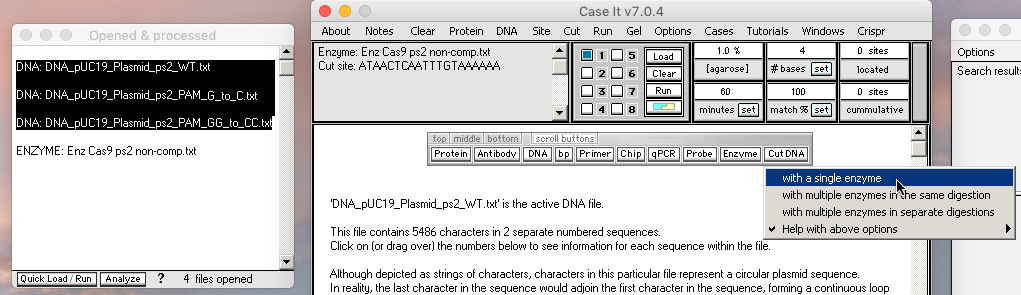
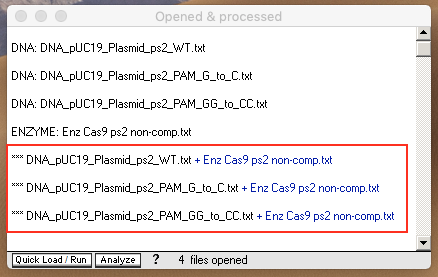
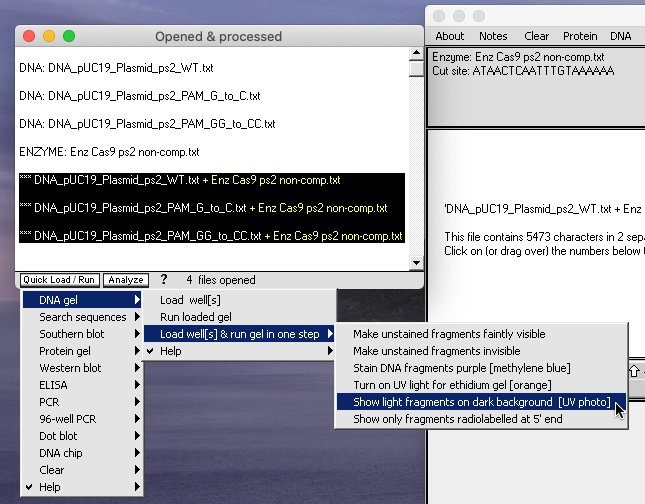
5. Shift-click to select the three DNA files, then use the Cut DNA button and select ‘with a single enzyme‘ from the drop-down menu. Three new lines will appear in the Opened & processed (O&P) window, with *** prefixes indicating that these DNA samples have been exposed to Cas9 for digestion. (Note that the left edge of the O&P window has been dragged to expand the window).
6. Shift-click to select the three ***DNA files, then click the Quick Load / Run button at the bottom of the O&P window and select ‘DNA gel => Load well[s] & run gel in one step => Show light fragments on dark background [UV photo]‘ from the drop-down menu. (The left edge of the O&P window has been dragged to expand the window even more).
7. Compare your gel with the gel illustrated in Fig S13 B in the Supplement to Jinek et al. 2012, and label and save the image.
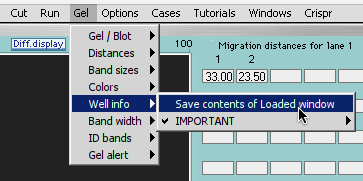
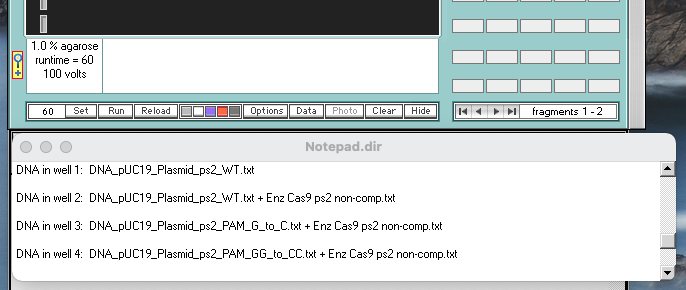
Note: Move the Loaded window to the left of the gel, drag the lower edge to show all of the information for the seven loaded wells, make a screenshot of the Loaded window and gel, and save it. Or, you can use the Gel menu to transfer the contents of the Loaded window to the Note Pad, and take a screen shot of the gel and Note Pad. You can also save or copy the contents of the Note Pad. See note under Step 15 of Part 1 for more information.
Check to make sure that your Loaded window looks like this, then answer the questions below.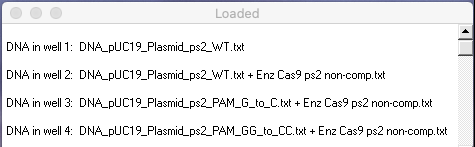
Questions: What does this gel tell you about the significance of the PAM sequence for Cas9 activity? What additional tests would need to be performed to examine this question in more detail?
The following steps recreate Fig S13 C of the Supplement to Jinek et al. 2012. The goal is to see how additional mutations in and around the PAM sequence affect Cas9 function.
8. Return windows to their default positions, then use the Clear menu at the top of the data screen and select ‘Clear everything => Yes‘. Then use the DNA button to open the file ‘DNA 1 kb ladder.txt‘ and click the Load button to load the ladder into well one.
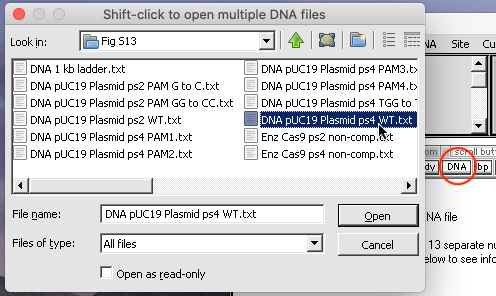
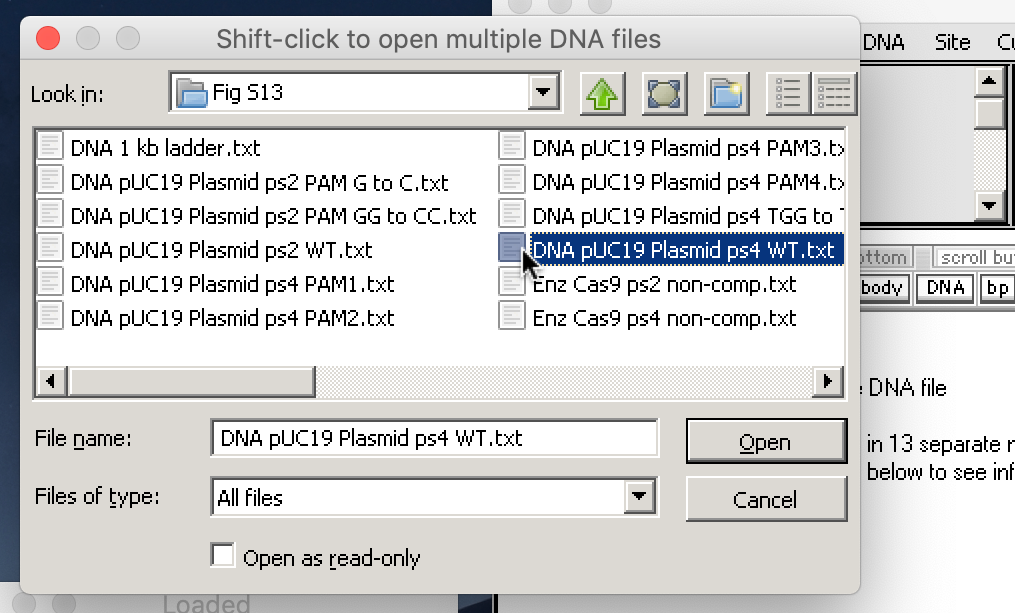
9. Use the DNA button to open the file ‘DNA pUC19 Plasmid ps4 WT.txt‘, click the square for well 2 to select it, then click the Load button.
Note: The backbone of this plasmid is pUC19, to which protospacer 4 (ps4) and its associated PAM had been added. WT stands for “wild type”, i.e. the normal PAM site without mutation.
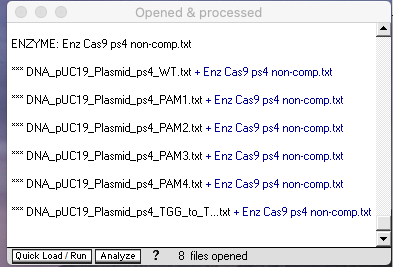
10. Shift-click to select, then open the five DNA files ‘DNA pUC19 Plasmid ps4 PAM1.txt’ through ‘DNA pUC19 Plasmid ps4 TGG to T..txt.’
Note: These five DNA plasmids have the mutations illustrated in Fig S13 C of the Supplement to Jinek et al. 2012. The first four mutations (designated PAM1, PAM2, PAM3, and PAM4 in the Supplement) are substitution mutations, meaning that nucleotides have been substituted in or close to the PAM site. The PAM site is underlined below, with the changes in boldface. For each, the normal or ‘wild type’ (WT) sequence is to the left of the arrow, and the mutation is to the right of the arrow:
PAM1: TGG => TCG
PAM2: TGG => TGC
PAM3: TGGCG => TGGCC
PAM4: TGGCG => TCCCC
The fifth mutation is a deletion mutation, meaning that two of the three nucleotides in the PAM site have been deleted. In the Supplement, this is referred to as ‘delta PAM’, with the △ symbol replacing the word ‘delta’:
△PAM: TGG => T
For our computer exercise, the filename used for the fifth mutation does not use the symbol △, but rather uses the actual deletion in the filename: ‘DNA pUC19 Plasmid ps4 TGG to T…txt‘.
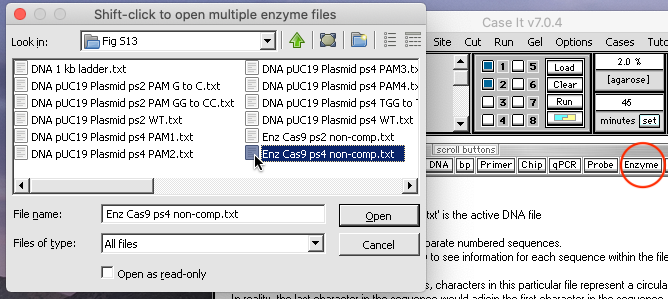
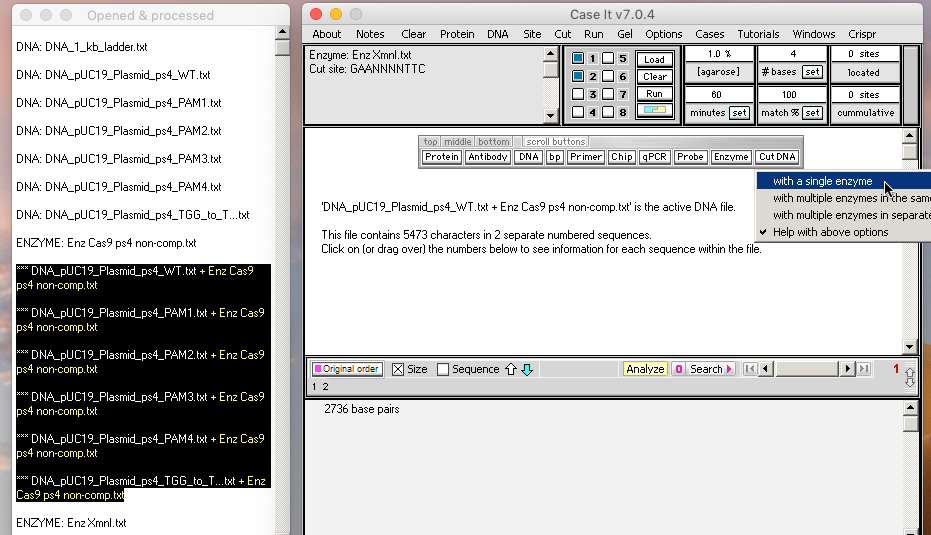
11. Click the Enzyme button and open the file ‘Enz Cas9 ps4 non-comp.txt‘.
Note: Although this file represents the entire Cas9 enzyme complex, it only contains the recognition site for protospacer 4 (non-complementary side of the DNA molecule) since that is all that the Case It program requires to find that site if it is present in a target sequence. In reality, guide RNA would need to be present incorporating this recognition site.
12. Expand the size of the Opened & processed window (by dragging the edge) so that all six plasmid files are visible, then shift-click to select all six plasmid files and use the Cut DNA button to select ‘with a single enzyme‘ from the drop-down menu. Six new lines will appear in the O&P window, each with a *** prefix indicating that it represents a digested sample (the left edge of the O&P window was dragged to expand the size of that window).
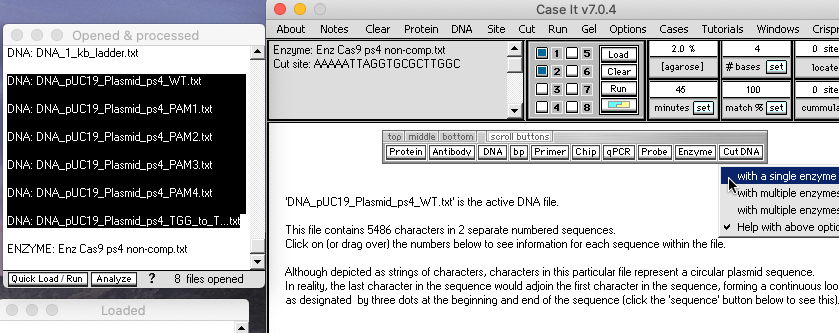
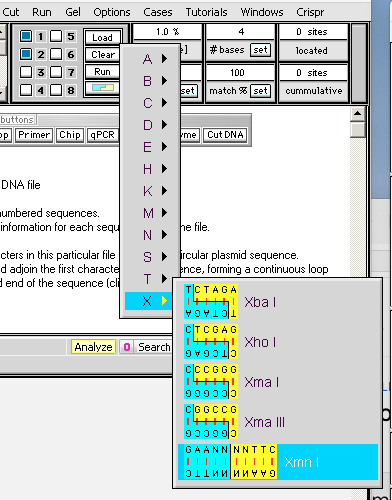
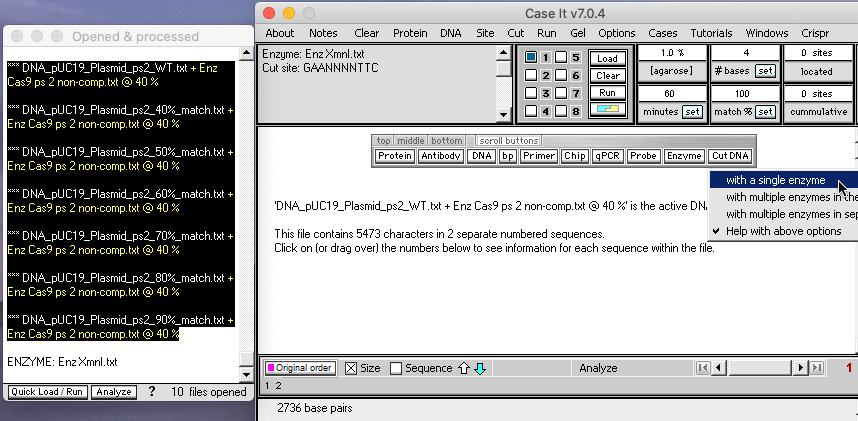
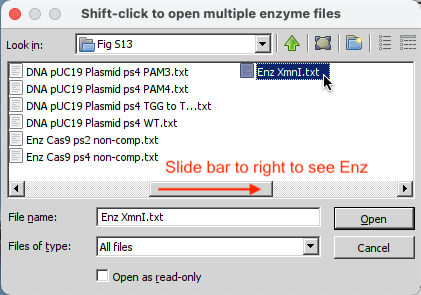
13. Use the Enzyme button to open the enzyme file ‘Enz XmnI.txt’. (Slide the dragbar to the right if you don’t see the enzyme file in the window).
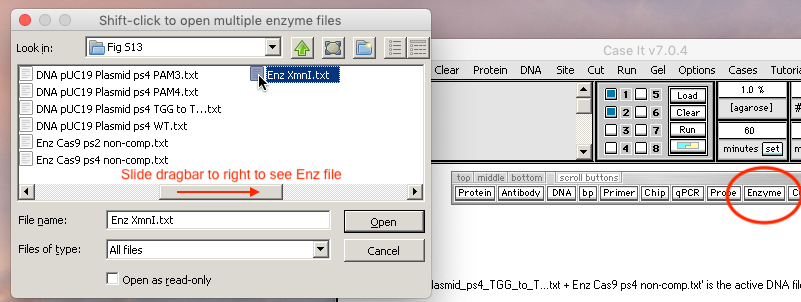
Note: You could also open this enzyme file via the blue/yellow button in the middle of the Data Screen. This shows the double-stranded nature of the cut site, and the nature of the cut (straight cut instead of stagger cut, with a series of N’s as part of the recognition site). N stands for ‘any nucleotide’.
Question: Why would you want to digest the plasmids with both Cas9 and XmnI?
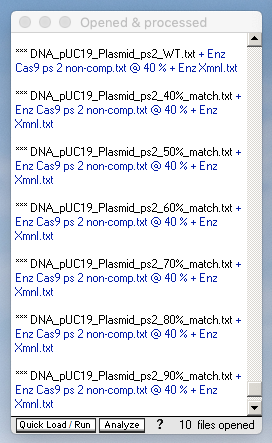
14. Shift-click to select the six digested (***) plasmid samples and use the Cut DNA button to select ‘with a single enzyme‘ from the drop-down menu. Six new lines appear in the O&P window, representing the six ‘double-digested’ samples.
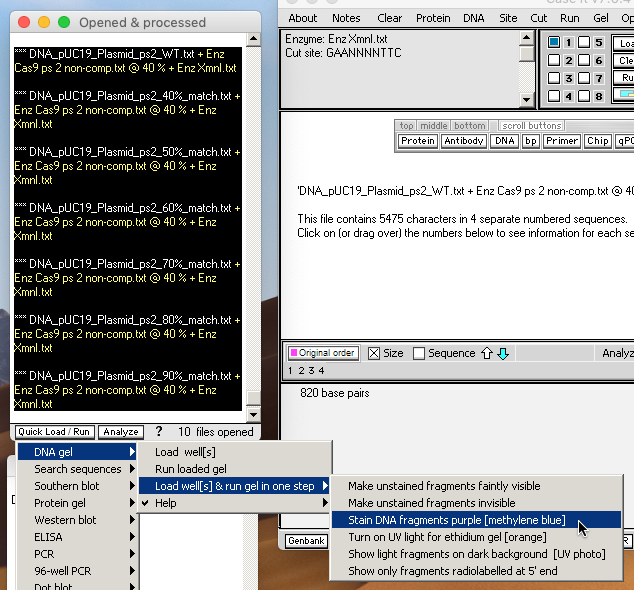
15. Shift-click to select the six double-digested plasmid samples and use the Quick Load / Run button at the bottom of the O&P window to select ‘DNA gel => Load well[s] & run gel in one step => Stain DNA fragments purple [methylene blue]‘
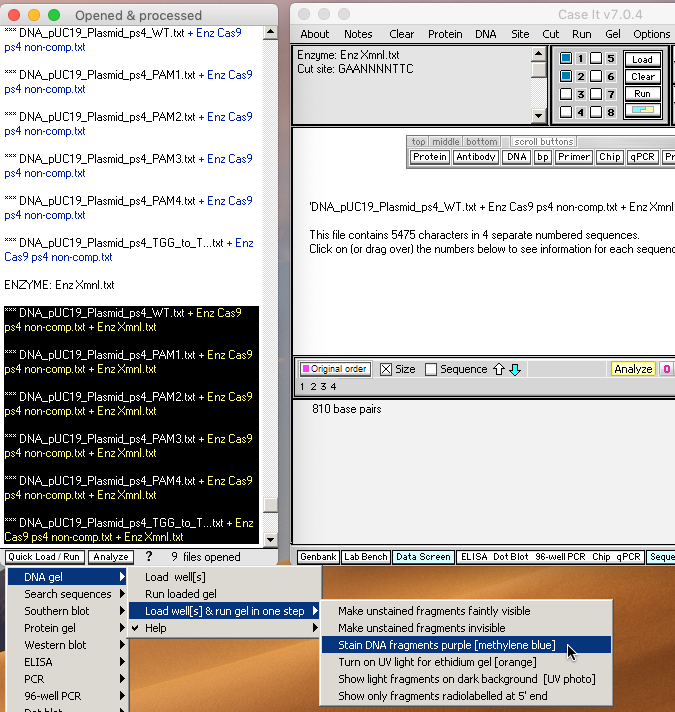
16. Compare your gel with the gel illustrated in Fig S13 C in the Supplement to Jinek et al. 2012, and label and save the image as described in Step 7 above. Note that your gel is easier to interpret than the actual gel in Fig S13C, because the bands are more visible.
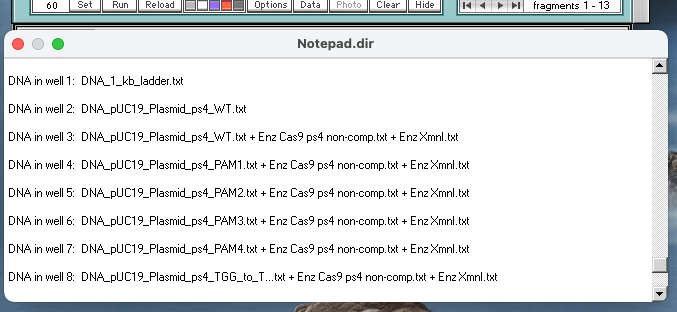
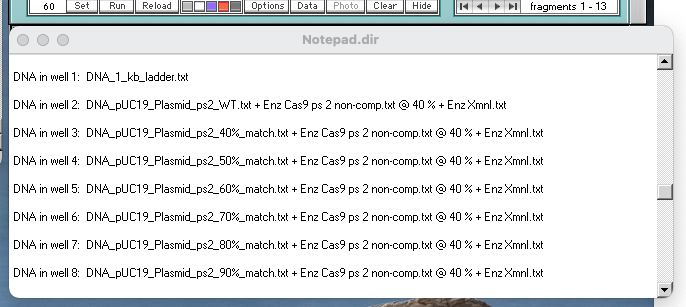
Note: Move the Loaded window to the left of the gel, drag the lower edge to show all of the information for the eight loaded wells, make a screen shot of the Loaded window and gel, and save it. Or, you can use the Gel menu to transfer the contents of the Loaded window to the Note Pad, and take a screen shot of the gel and Note Pad. You can also save or copy the contents of the Note Pad. See note under Step 15 of Part 1 for more information.
Check to make sure that your Loaded window looks like this, then answer the questions below.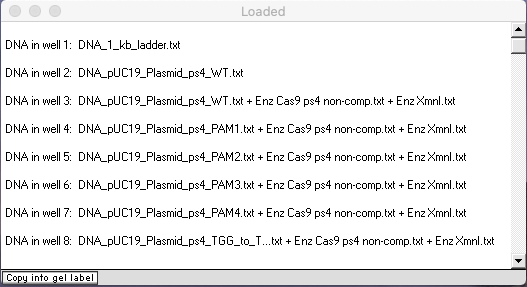
Use your virtual gel to answer these questions, since bands are harder to see on the actual gel.
A. Three of the eight lanes have two bands, but the bands differ in position for one of those three lanes. Explain why there are differences in positions for these three lanes.
B. Why do four of the lanes have a single band, all in the same position?
C. Why does the result for the PAM3 mutation differ from those of the other PAM mutants, and what does that tell you about the relationship between Cas9 function and nucleotides in or close by the PAM site?
The following steps recreate Fig 3E of Jinek et al. 2012. The goal is to determine how sensitive Cas9 is to mismatches between the Cas9’s programmed sequence and the recognition site on the target sequence. A series of plasmids with various mismatches were created for use in this experiment.
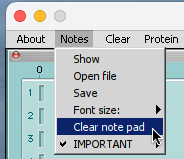
17. Return windows to their default positions, then use the Clear menu at the top of the data screen and select ‘Clear everything => Yes‘. (This will not clear the Note Pad. To do that, use the Notes menu.)
18. Use the DNA button to open the file ‘DNA 1 kb ladder.txt‘ that is inside the folder CRISPR data => Fig 3E, then click the line in the O&P window to activate that file for loading. Click the Load button to load the ladder into well one.
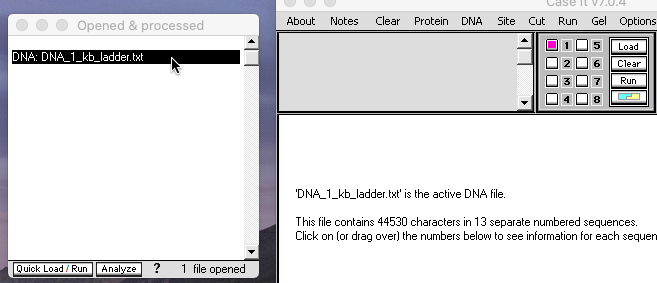
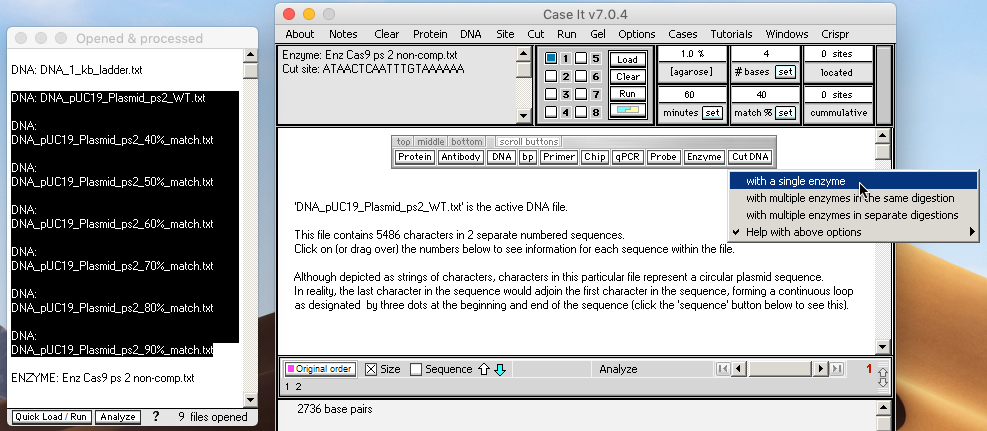
19. Use the DNA button to open the file ‘DNA pUC19 Plasmid ps2 WT.txt‘ that is inside the folder CRISPR data => Fig 3E.
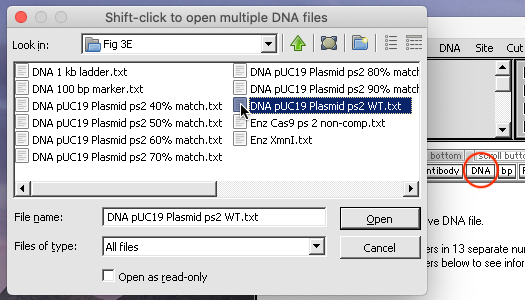
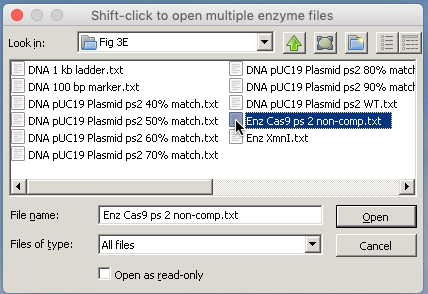
20. Use the DNA button again, and shift-click to select, then open the remaining 6 DNA plasmid files (40% match to 90% match).
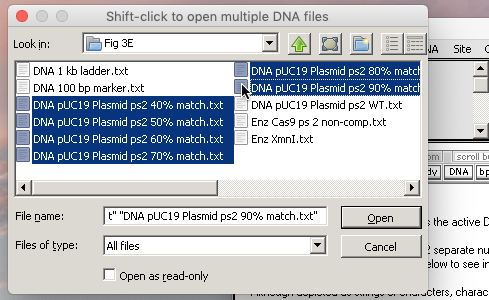
21. Use the Enzyme button to open ‘Enz Cas9 ps 2 non-comp.txt‘.
Note: This Cas9 enzyme was programmed to recognize the protospacer 2 sequence of the ‘wild type’ plasmid (DNA pUC 19 Plasmid ps2 WT.txt). To determine how sensitive the enzyme is to mismatch, six mutated plasmids were created with matches of 40, 50, 60, 70, 80, and 90% between the protospacer 2 sequence of the plasmid and the protospacer 2 recognition site of the enzyme.
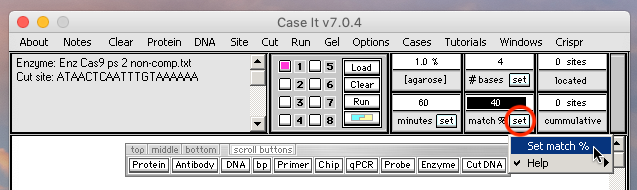
22. Change the ‘match %’ setting to 40, by double-clicking or dragging the field and typing in the number 40, then clicking the Set button and selecting ‘Set match %’ from the drop-down menu.
Note: The default setting requires a 100% match between an enzyme’s recognition site and locations on the target DNA, but this requirement can be lowered by changing the match % setting as was done here. For this particular experiment, the goal is to see how much the match % can be lowered before Cas9 is unable to recognize the protospacer site on a plasmid DNA sequence. Forty percent is the low end of the range for the six mutated plasmids, so that is why the match % is being lowered to that value.
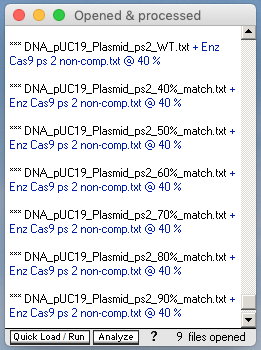
23. Expand the size of the O&P window by dragging the bottom edge down, so that all seven plasmid sequences are visible, including the WT sequence. Shift-click to select all seven of the plasmid sequences, then click the Cut DNA button and select ‘with a single enzyme‘ from the drop-down menu. Seven new lines will appear in the O&P window, with *** prefixes, representing the seven Cas9-digested plasmid sequences.
Note: The filenames contain two percentages, the first (in black) represents the % match in the protospacer 2 sequences for the various plasmids (40,50,60,70,80, and 90%). The second percentage (in blue) is the match% setting. That is 40% for all seven digestions, since it was set prior to digestion of the plasmids with Cas9.
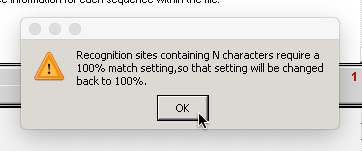
24. Use the Enzyme button to open the restriction enzyme XmnI. Before the enzyme file opens, you will get an alert message that the match % setting has been automatically changed back to 100%. Click OK on this message.
Note: The match % must be set back to 100 because the recognition site for XmnI contains ‘N’ characters (N = any of the four nucleotides), and the Case It software does not allow for anything other than a 100% match when using such recognition sites. The Cas9 protospacer 2 recognition site does not contain N characters, so that is the reason that the match% setting could be lower for Steps 22 and 23 above. The match % could have been manually changed back to 100 before Step 23, but that was not necessary because the program does it for you.
25. Shift-click to select all seven of the Cas9-digested sequences, then then click the Cut DNA button and select ‘with a single enzyme‘ from the drop-down menu. Seven new lines will appear in the O&P window, with *** prefixes, representing the seven Cas9/Xmnl-digested plasmid sequences.
26. Shift-click to select all seven of the Cas9/Xmnl-digested sequences, then use the Quick Load / Run button at the bottom of the O&P window to select ‘DNA gel => Load well[s] & run gel in one step => Stain DNA fragments purple [methylene blue]’.
Note: Move the Loaded window to the left of the gel, drag the lower edge to show all of the information for the eight loaded wells, make a screen shot of the Loaded window and gel, and save it. Or, you can use the Gel menu to transfer the contents of the Loaded window to the Note Pad, and take a screen shot of the gel and Note Pad. You can also save or copy the contents of the Note Pad. See note under Step 15 of Part 1 for more information.
Check to make sure that your Loaded window looks like this, then answer the questions below.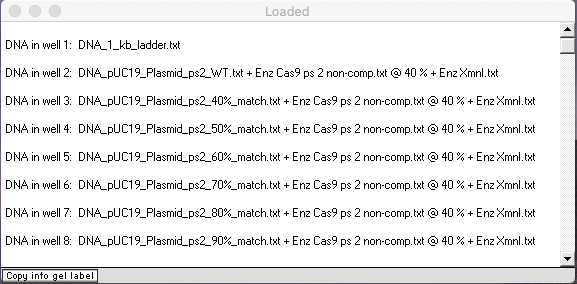
Questions:
A. How sensitive is Cas9 to mismatches between the Cas9’s programmed sequence and the recognition site on the target sequence?
B. Is Cas9 more sensitive the mismatches closer to the PAM site, or further away from the PAM site? Does this particular experiment really test this? If not, what additional experiment would be needed. Looking through Jinek et al. 2012 and its Supplement, was this experiment carried out?
C. What is the practical significance of results of the mismatch experiment, in terms of applicability of the Cas9 CRISPR system to gene editing and other real-world applications?
The last part of the exercise demonstrates a feature of the software that allows visualization of the double-stranded configuration of DNA, in relation to enzyme recognition and PAM sites.
27. Use the Clear menu at the top of the data screen and select ‘Clear everything => Yes‘. Then use the DNA button on the silver button bar to open the file ‘DNA_Plasmid_ps2_WT.txt‘ that is inside the folder CRISPR data => Fig S13.
28. Click the Enzyme button on the silver button bar to open the file ‘Enz Cas9 ps2 non-comp.txt‘.
Note: Although this file only contains the protospacer 2 recognition site, it represents the entire Cas9 complex required to locate target sites.
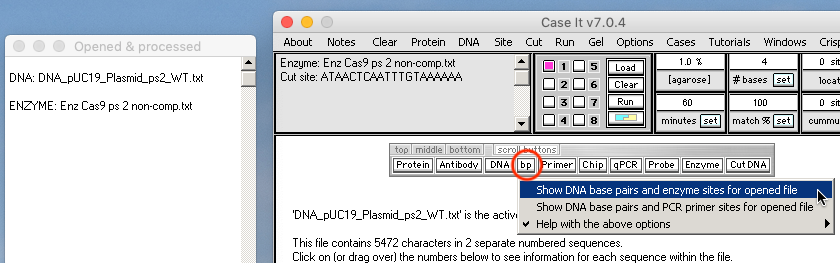
29. Click the bp button on the silver button bar and select Show DNA base pairs and enzyme sites for opened file. The Base Pairs window will open with the first 60 base pairs of the plasmid sequence visible.
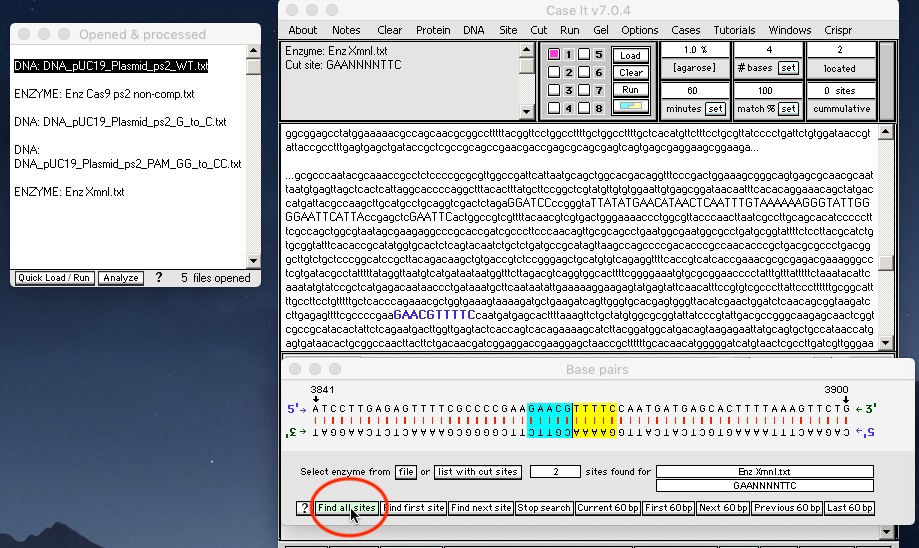
30. Slowly click* the green Find all sites button at the bottom of the Base Pairs window.
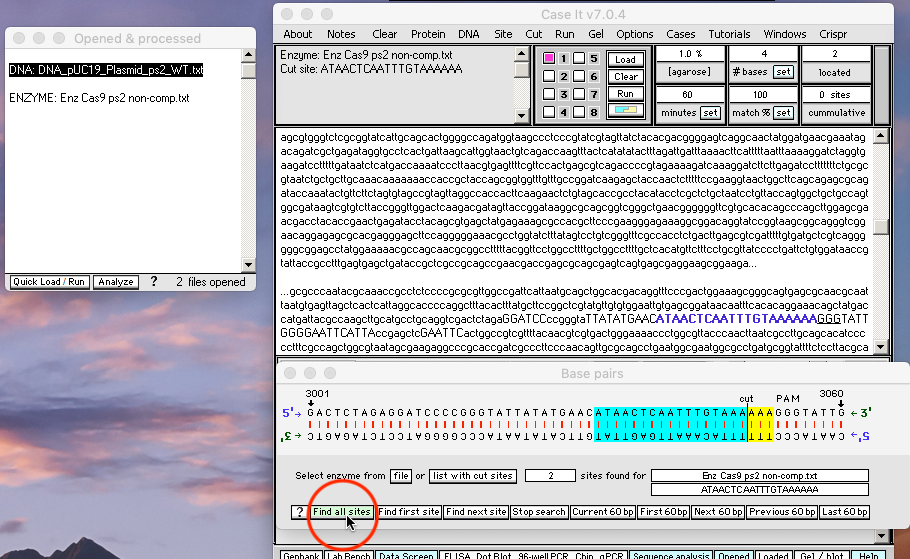
*Hold down the mouse button for a second or two before releasing it.
31. Two Cas9 protospacer-recognition sites have been located and the second one is shown in the double-stranded configuration, with the cut site three base pairs “upstream” of the PAM site (GGG). There is a 100 percent match, indicated by the blue and yellow colors on either side of the cut (this is the color scheme that Case It uses for restriction enzyme sites). The site is also shown in blue text in the plasmid sequence which is visible in the upper window of the Data Screen, with the PAM site underlined.
Note: The Base Pairs window shows sequences in 60 bp increments, as 60 is the number of bp that will fit in the window. Buttons on the window allow you to navigate 60 bp at a time, forwards or backwards. If a cut site should happen to fall at the very beginning or very end of a particular 60 bp sequence, then a few of the bp may be highlighted with gray rather than blue or yellow. However, if all of the bp are highlighted with gray, that is an indication that something is missing that would otherwise allow Cas9 to cut at that particular site. If most or all of the bp are highlighted with blue or yellow, then Cas9 would cut at that particular location.
32. Slowly click the Find first site button. The first site is located, but only blue will be visible (because the Base Pairs window can only show the double-stranded configuration 60 base pairs at a time, so only the blue end of the protospacer site is showing).
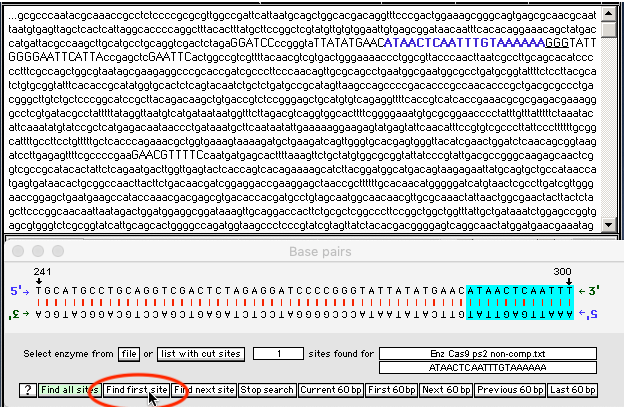
33. To see the rest of the recognition site, click the Next 60 bp button.
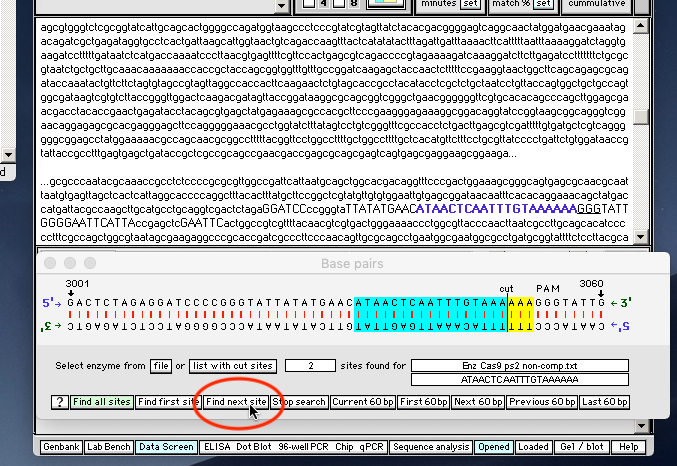
34. Slowly click the Find next site button to see the second and final site again.
Note: There are two sites in the file because uncut plasmids migrate on a gel in two configurations, ‘supercoiled’ and ‘open-circular’, and the Case It software requires two identical plasmid sequences be present so that this condition can be simulated when run on a gel. These two configurations migrate at different rates on a gel, so are visible as separate bands.
35. Use the DNA button on the silver button bar to open the files ‘DNA pUC19 Plasmid ps2 G to C.txt’ and ‘DNA pUC19 Plasmid ps2 PAM GG to CC.txt‘.
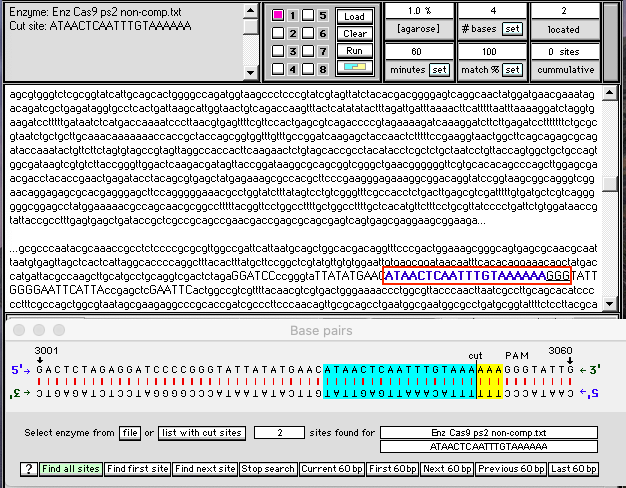
36. Click on either one of these two files, representing plasmids with mutated PAM sequences. This action clears the Base Pairs window and displays the first 60 characters of the file in that window. Simultaneously, the entire sequence for that file is displayed on the large field of the Data Screen.
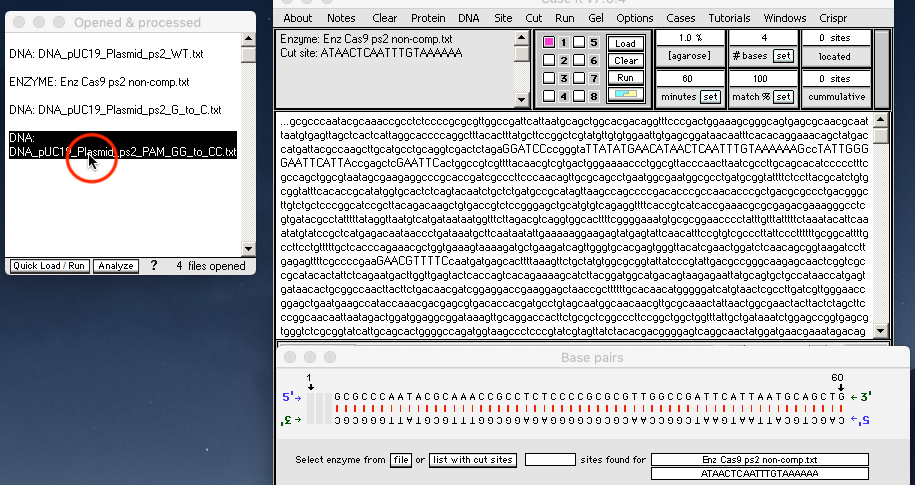
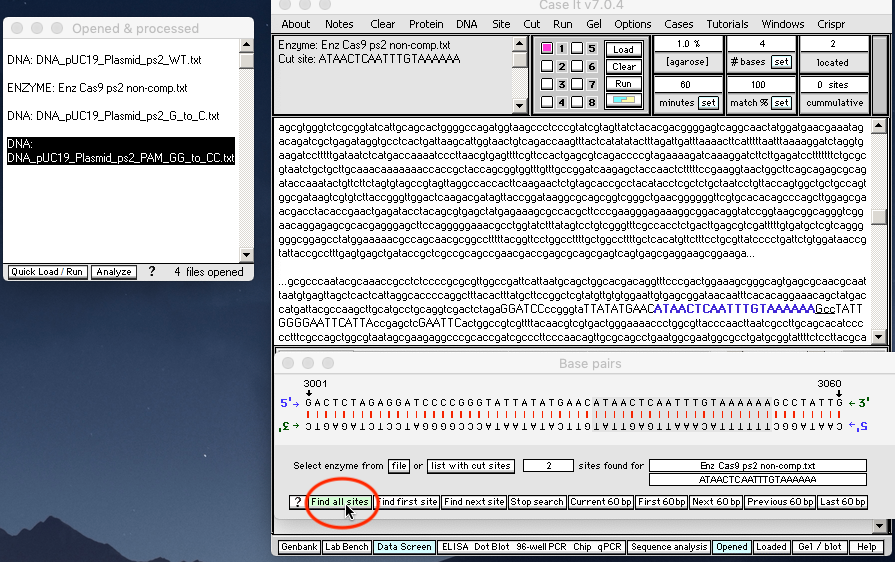
37. Slowly click the green Find all sites button at the bottom of the Base Pairs window.
Question: Comparing results for the image linked in Step 31 with that for the image linked in Step 37, what are the differences, and why?
38. Any restriction enzyme site can be found using the above procedure, showing its double-stranded configuration. For example, you can open the XmnI enzyme and find its location on the plasmid. Before doing so, make sure to click a DNA plasmid line in the O&P window, to get a fresh sequence to work with. Recall from Step 24 that the XmnI recognition site contains ‘N’ characters (N = any nucleotide base).
Note: Because of the way the Base Pairs window works, restriction enzymes sites containing N’s may have random letters at those locations, which may not match the letters in the sequence shown in the large field of the Data Screen. For example, for XmnI (GAANNNNTTC) you may see GAACGCCTTC in the base pairs window and GAACGTTTTC in the large field of the Data Screen. What is important for this enzyme are the first three letters (GAA) and the last three letters (TTC), as the four letters in between can be any of the four nucleotide bases (A,T,C, or G).
39. As another example, a site for the restriction enzyme SalI is located on the plasmid used for Fig 1 of Jinek et al. 2012, as detailed in Step 5 of the Plasmid construction exercise. To locate the SalI site:
(1) Use the Clear menu at the top of the data screen and select ‘Clear everything => Yes‘.
(2) Use the DNA button to open the file ‘DNA_Plasmid_ps2_WT.txt‘ that is inside the folder CRISPR data => Fig 1, S3, S5.
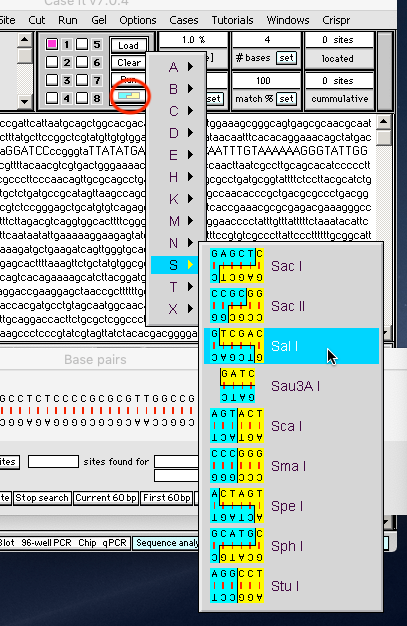
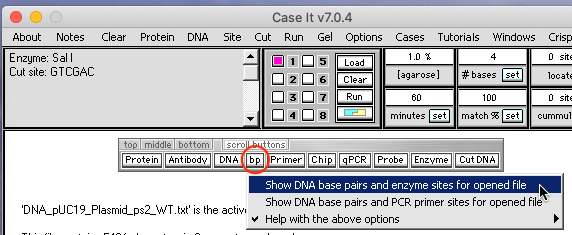
(3) Click the blue/yellow button on the data screen and select ‘S => Sal I’ from the drop-down menu.
(4) Click the bp button on the silver button bar and select Show DNA base pairs and enzyme sites for opened file.
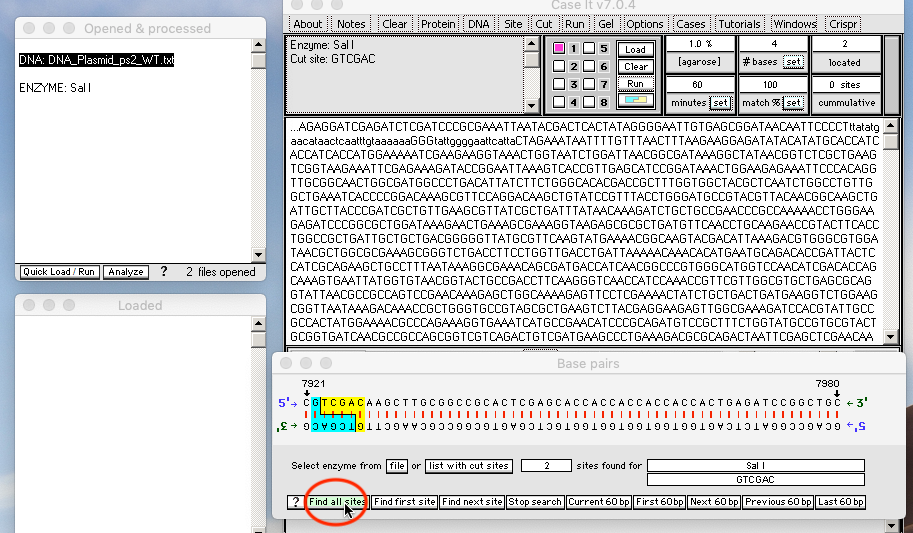
(5) Click the green Find all sites button on the Base Pairs window to locate the SalI sites.
(6). Click the Find first site and Find next site buttons to see both sites for SalI
40. To compare the cut sites of SalI and XmnI:
(1) Click the plasmid line in the O&P window to refresh the sequence
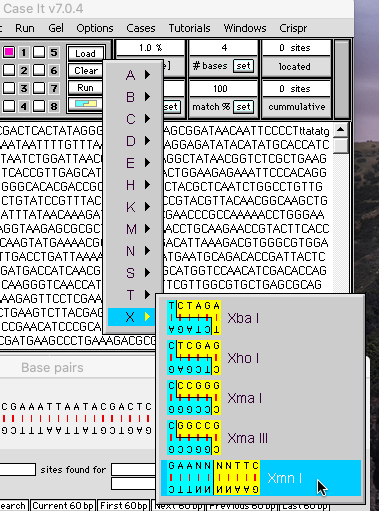
(2) Click the blue/yellow button and select XmnI
(3). Click the Find all sites button.
(4). Click the Find first site and Find next site buttons to see both sites for XmnI.
(5). To see the SalI site again, click the plasmid line to refresh the sequence, click the SalI line in the O&P window, then click the Find all sites button.
Question: How does the cut type for XmnI differ from that of SalI? Which of these two types of cuts would be more useful when constructing plasmids, and why?
Top of this page
Go back to Part 1: Experiments on site-specific actions of Cas9
Go back to Part 2: Experiments with mutations to determine Cas9 gene function
Go to Part 4: Experiments targeting GFP gene sequences