Goal of this exercise: Analyze experiments by Kariko et al. 2005 that led to the development of mRNA vaccines for COVID and other diseases. Part 3 uses ELISA analysis and flow cytometry to determine the effect of mRNA modifications on the immune response of dendritic cells.
Part 1: Background information on mRNA vaccines, the immune system, and experimental techniques
Part 2: Determining the inflammatory properties of in vitro-transcribed and naturally occurring mRNA
Part 3: Determining the effect of mRNA modifications on the immune response of dendritic cells
Organization of Part 3
Steps 1-12. Determining the effect of mRNA modifications on the immune response of dendritic cells
Step 13. Questions to consider
Steps 14-21. Using flow cytometry to determine the effects of nucleoside modification on the expression of markers for the immune response
Step 22. Questions to consider
1. If you have not already done so, go through Steps 2-16 of Part 2 to familiarize yourself with the procedure of conducting cytokine ELISA with Case It. You will be using this exact same procedure for the analyses below, using different samples.
2. Use the Clear option shown below. (This will clear the ELISA plate and opened files, but will not clear the charts that you saved in Part 2, on Tabs 1-8.)
DETERMINING THE EFFECT OF mRNA MODIFICATIONS ON THE IMMUNE RESPONSE OF DENDRITIC CELLS
Goal of Steps 3-12: To compare the production of three cytokines (TNF-alpha, IL-12, and IFN-alpha) by monocyte-derived dendritic cells produced in vitro, and also two types of dendritic cells isolated from peripheral blood (DC1 and DC2) Increased levels of these cytokines are associated with a more intense immune response.
Steps 3-10: Experiments with MDDCs generated via GM-CSF and IL4*
Step11: Experiments with MDDCs generated via IFN-alpha
Step12: Experiments with DCs isolated from peripheral blood
*Kariko et al. 2005 do not implicitly state how ‘MDDCs’ differ from ‘IFN-alpha generated MDDCs’, but a reading of their methods section implies that the former were generated by exposing monocytes to GM-CSF and IL4.
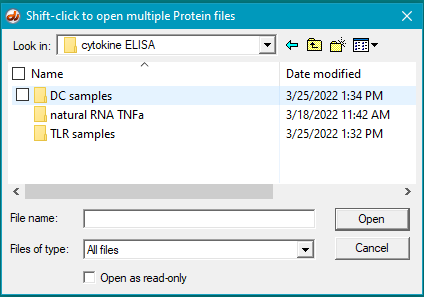
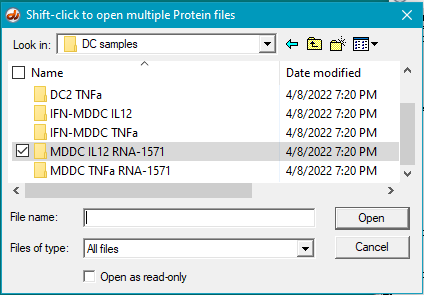
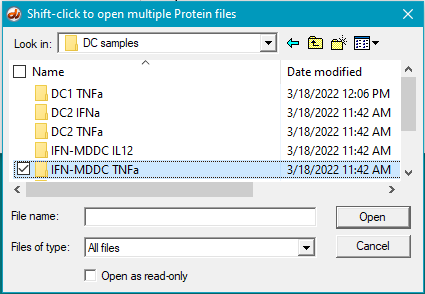
3. Use the Protein button on the silver button bar to open the DC samples folder (mRNA data -> cytokine ELISA -> DC samples).
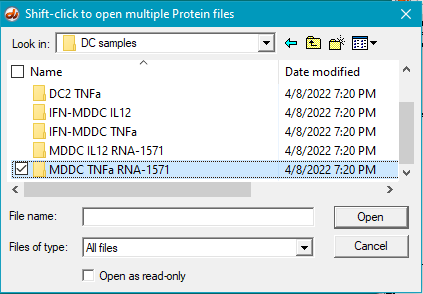
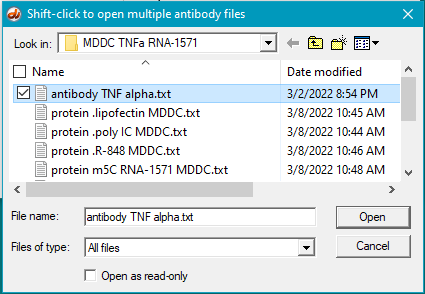
4. Open the MDDC TNFa RNA-1571 folder that is inside the DC samples folder.
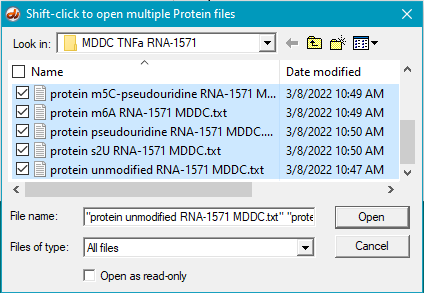
5. Select the first protein, then shift-click on the last protein to select them all (be sure the files are arranged alphabetically so that the antibody file is first in the list).
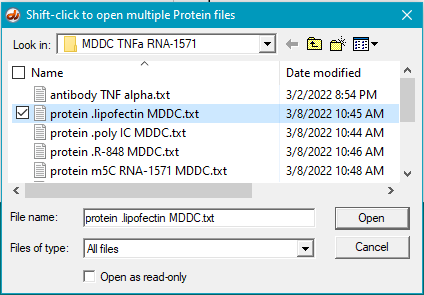
6. Click the Antibody button on the silver button bar and open the file antibody TNF alpha.txt. That filename will appear in the Opened & processed window (as it did in Step 10 of Part 2).
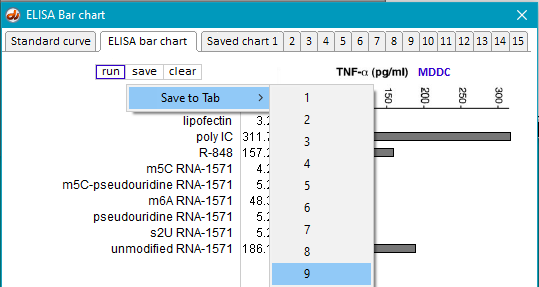
7. Use the procedure in Steps 10-16 of Part 2 to generate an ELISA bar chart for the samples in this folder, saving the result temporarily on Tab 9 of the bar chart (assuming that you still have charts saved on Tabs 1-8 from Part 2).
8. Clear the ELISA plate and all open files.
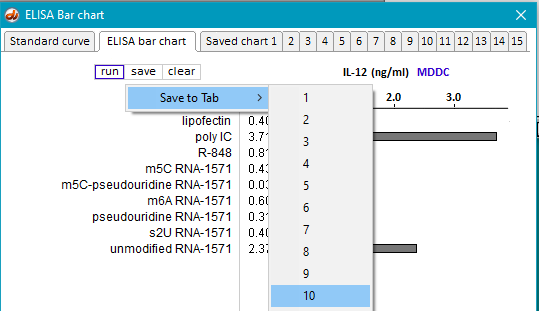
9. Repeat Steps 3-7 above using samples inside folder MDDC IL12 RNA-1571.
10. Save the resulting bar chart on Tab 10.
11. Repeat the above procedure using the samples inside the folders IFN-MDDC TNFa and IFN-MDDC IL12, and save those results on Tabs 11and 12, respectively.
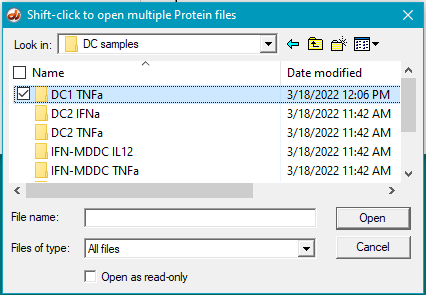
12. Repeat the above procedure using the samples inside the folders DC1 TNFa, DC2 IFNa, and DC2 TNFa, and save those results on Tabs 13, 14, and 15.
13. Questions to consider: Compare the saved charts on Tabs 9-15 and consider the questions below. Consult the glossary of terms from Part 1 to help formulate your responses. Be sure to make your comparisons based on the relative heights of bars, rather than their absolute heights.
(1) Why were lipofection, poly IC and R-848 included in the cytokine ELISA runs?
(2) Is the relative effect of unmodified mRNA on cytokine production the same for the three cytokines (TNF-alpha, IL-12, and IFN-alpha)? What might account for any differences that you observed?
(3) What are the relative effects of the various nucleoside modifications for the three cytokines, comparing cytokine-generated DCs (MDDCs and IFN-alpha MDDCs) to primary blood DCs (DC1 and DC2)?
(4) For DC1 and DC2, compare the production of cytokines when exposed to RNA modified with:
—pseudouridine alone
—m6A alone
—a mixture of pseudouridine-modified RNA and m6A-modified RNA, in separate molecules (“m6A plus pseudouridine”)
—RNA with both modifications on the same molecule (“m6A-pseudouiridine”)
What conclusion can be reached from this comparison, and why is this conclusion so significant?
DETERMINE THE EFFECTS OF NUCLEOSIDE MODIFICATION ON THE EXPRESSION OF MARKERS FOR THE IMMUNE RESPONSE
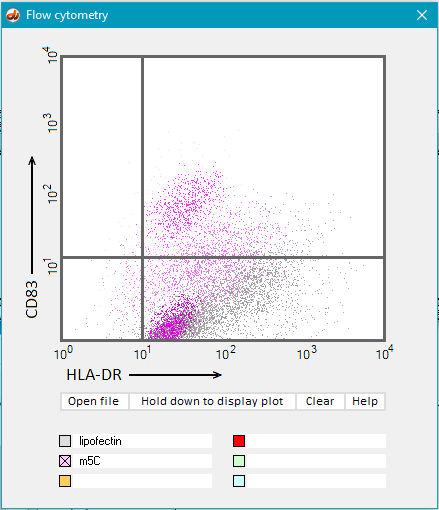
Goal of Steps 14-21: Using flow cytometry to compare the expression of the markers CD83 and HLA-DR on dendritic cells exposed to modified nucleosides and controls.
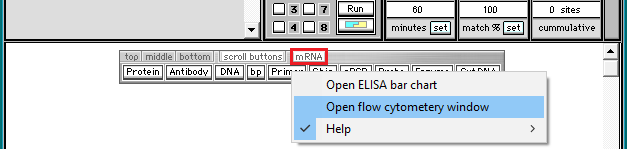
14. Use the mRNA button to open the Flow Cytometry window.
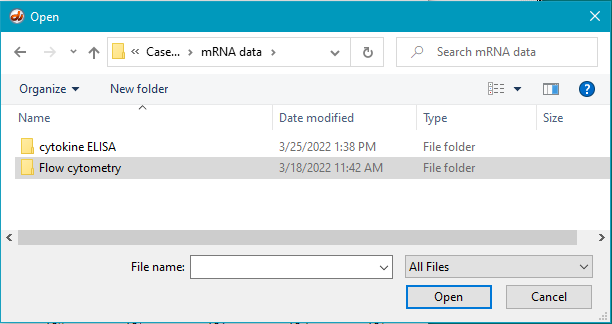
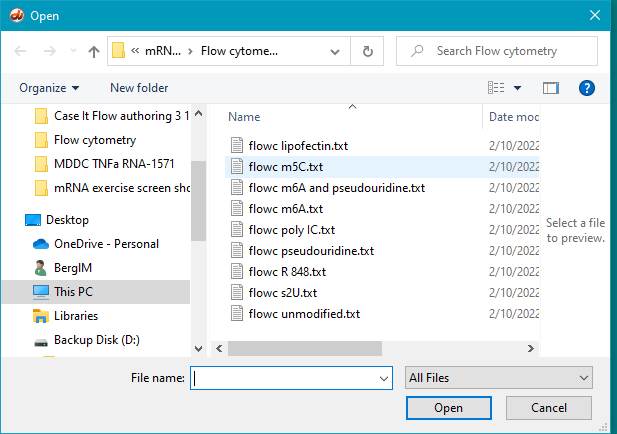
15. Click the Open file button.
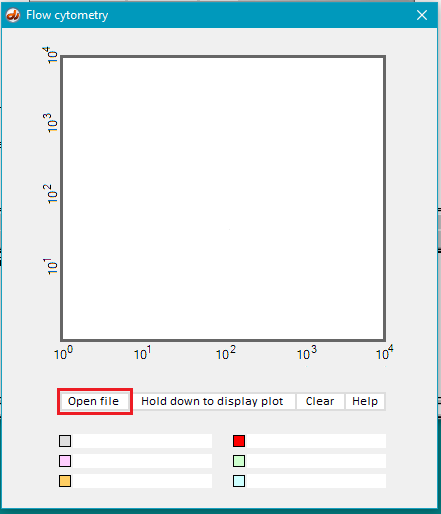
16. Open the Flow cytometry folder, if it is not already open.
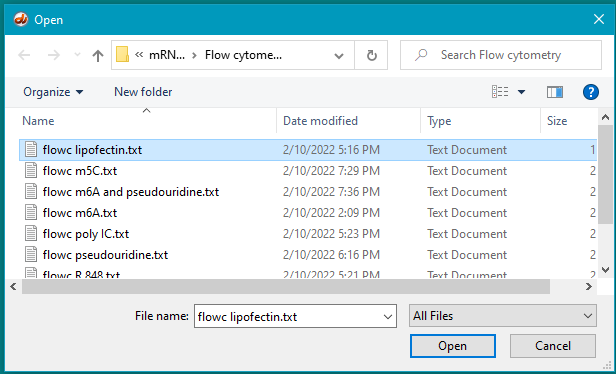
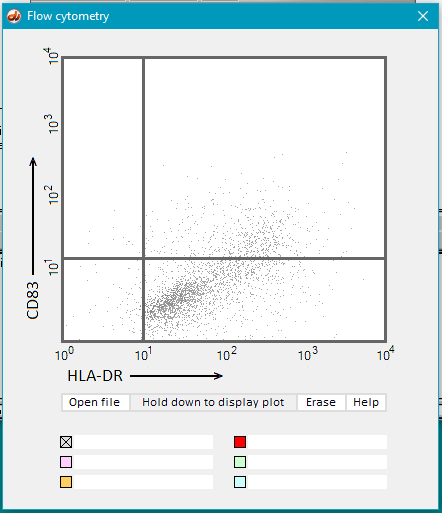
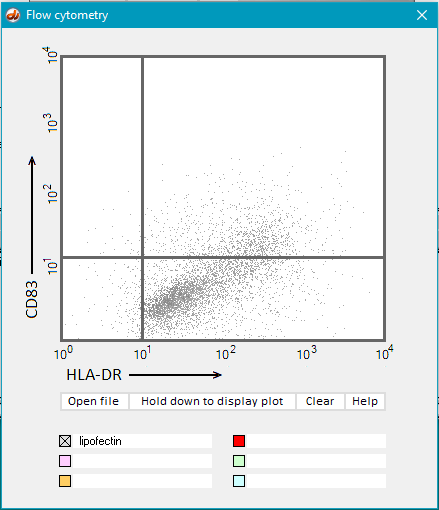
17. Hold down the Hold down to display plot button and dots will gradually appear on the display. Continue to hold the button down until the display is complete (second image below). Part of the file name (‘lipofectin’) appears by default by the gray checkbox after the mouse button is released.
Note: The gray checkbox will be selected automatically file, but this can be overridden by selecting a different color after opening a file.
18. Open the file flow m5C.txt.
19. Hold down the Hold down to display plot button until all of the purple dots have appeared.
20. Hold down the Hold down to display plot button until all of the purple dots have appeared.
21. At this point there are two approaches to take. You could continue to open files and add points to the plot or take screenshots of individual plots*. Regardless of how you decide to do this, finish plotting the files and consider the questions below.
*You cannot permanently save results directly from the program, so you need to make screenshots. The easiest way to do this on Windows computers is to use the Windows-Shift-S key combination, then drag the part of the screen you want to save. On Macs, Preview or the Screenshot app can be used.
22. Questions to consider: Consult the glossary of terms from Part 1 to help formulate your responses.
(1) Why were CD83 and HLA-DR used for the flow cytometry analysis?
(2) Do results from the flow cytometry analysis agree with results from the cytokine ELISA analyses in Parts 2 and 3?
(3) What general conclusions can you make based on the results of these analyses? Which of the mRNA modifications appear most effective at reducing the immune response?
(4) Consider this relatively recent publication on mRNA vaccines. How did Kariko et al. 2005 set the stage for the development of the COVID vaccines?
Go to Part 1: Background information on mRNA vaccines, the immune system, and experimental techniques
Go to Part 2: Determining the inflammatory properties of in vitro-transcribed and naturally occurring mRNA
Go back to the top of this page