Goal of this exercise: Analyze experiments by Kariko et al. 2005 that led to the development of mRNA vaccines for COVID and other diseases. Part 2 uses cytokine ELISA analysis to determine the effect of naturally occurring and in vitro-transcribed mRNA on the immune response.
Part 1: Background information on mRNA vaccines, the immune system, and experimental techniques
Part 2: Determining the inflammatory properties of in vitro-transcribed and naturally occurring mRNA
Part 3: Determining the effect of mRNA on the immune response of dendritic cells
Organization of Part 2
Step 1. Download Case It v705
Steps 2-16. Determining the inflammatory properties of naturally occurring RNA
Step 17. Questions to consider
Step 18. Determining the inflammatory properties of in-vitro transcribed mRNA on TLR 3, 7 and 8
Step 30. Questions to consider
Step 31. Determining the inflammatory properties of natural mRNA on TLR 3, 7, 8 and 9
Step 39. Questions to consider
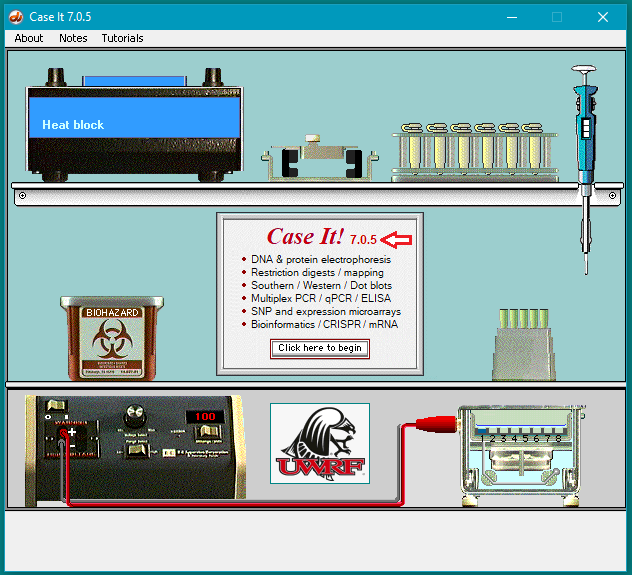
This exercise requires Case It v7.0.5, as shown at the arrow on the splash screen below. If you are using an earlier version, download v7.0.5 before continuing.
- The opening screen of Case It v7.0.5 is shown below (click to enlarge). Click the button on this screen, which leads to a second informational screen. Clicking the button on that screen will take you to the main screen of the program, called the ‘Data Screen’.
If you are using Case It on a Mac, read these instructions for accessing files.
DETERMINING THE INFLAMMATORY PROPERTIES OF NATURALLY OCCURING mRNA
Goal of Steps 2-16: Use cytokine ELISA to compare the production of Tumor Necrosis Factor-alpha (TNF-alpha) by monocyte-derived dendritic cells (MDDCs), after the MDDCs have been transfected with naturally occurring mRNA. Increased levels of TNF-alpha are associated with a more intense immune response.
2. If Case It v7.0.5 is already open, use the Clear menu and select Clear > Clear everything? > Yes.
3. Click the mRNA button on the silver button bar, and select Open ELISA bar chart from the drop-down menu.
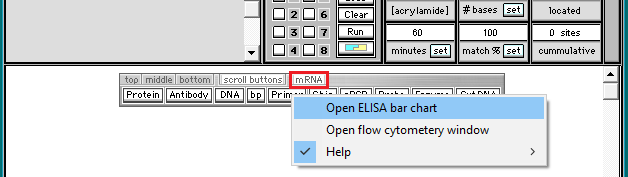
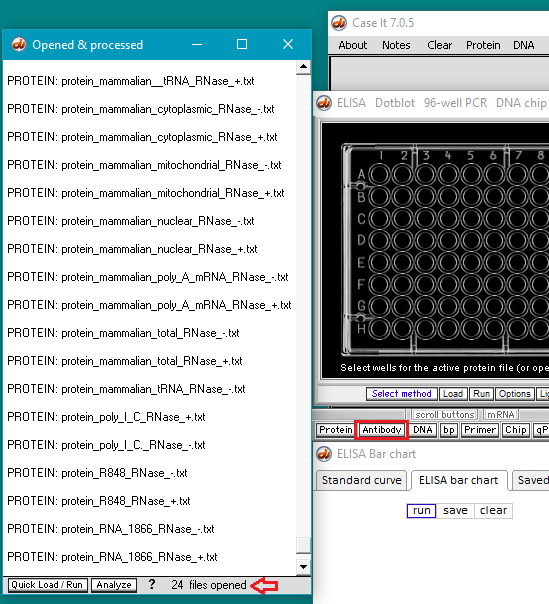
New windows will appear, as shown below. Note that the silver button bar has moved to a location directly underneath the 96-well ELISA plate. Opened files will appear on the left, and the bar chart interpretation of ELISA results will appear in the bottom window.
Note: The very first time that the mRNA button is used, the Opened & processed window appears as shown below left, expanded beyond its normal default position. Subsequent use of the button will not affect the size or position of the window.
4. Click the Protein button on the silver bar as shown in the red box below.
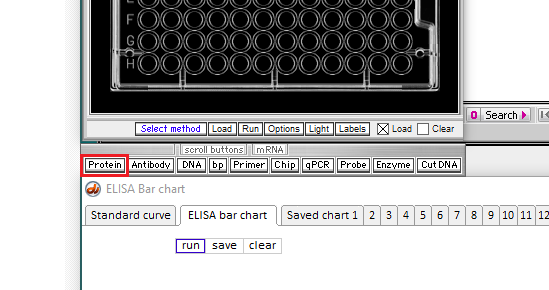
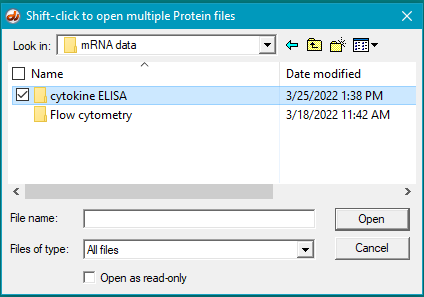
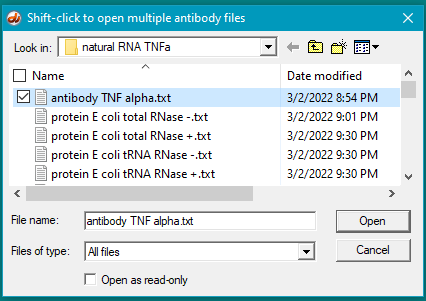
5. Open the mRNA data folder that is inside the Case it v705 folder…
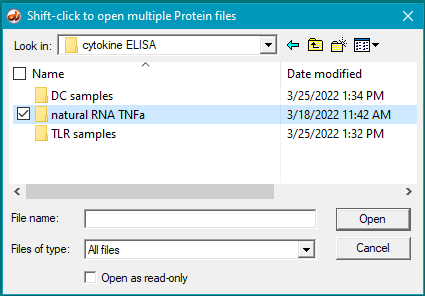
…then open the natural RNA TNFa folder that is inside the cytokine ELISA folder…
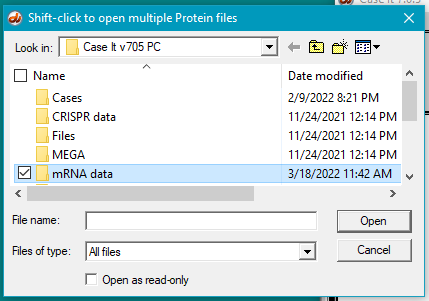
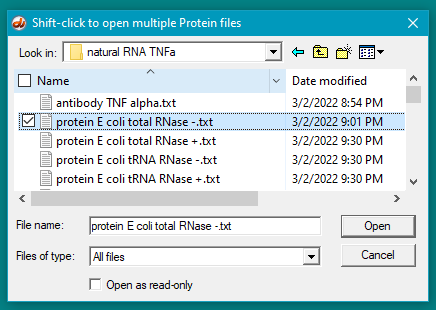
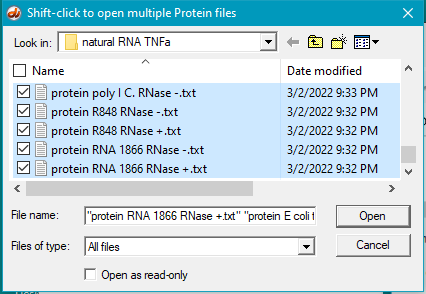
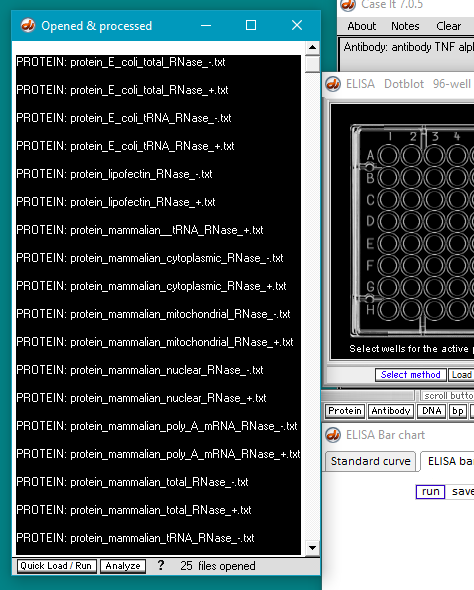
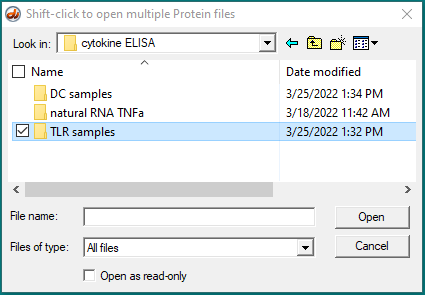
6. For this step, see the two images below. Click the first protein file, then scroll to the bottom and shift-click on the last protein file (click on the last protein file while holding down the shift key). This action will select all of the protein files simultaneously, as shown in the second image below.
There are 24 protein files in this particular folder, so make sure to select all of them. The files should be arranged alphabetically, with the first protein file immediately below the antibody file as shown below. (If this is not the case, use the ‘Name’ header to arrange the files with the antibody file on top.)
*Note: The images below show how the window appears on Windows. To see the appearance on the Mac, click here. Then return to this page.
7. Click the Open button. The 24 protein filenames appear in the Opened & processed window, as shown below (not all of the files will be visible without scrolling). The message ’24 files opened’ should appear at the bottom of the window).
8. Click on the Antibody button on the silver bar, shown in the red box above.
9. Double-click on the antibody file to open it (or single-click to select it, then click the Open button).
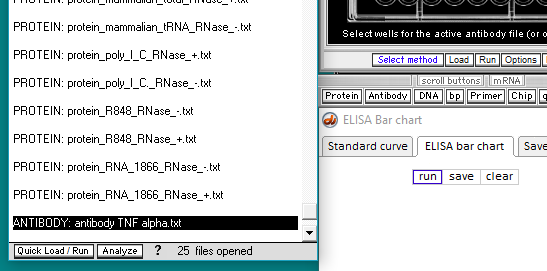
10. The antibody file name appears as the last line in the Opened & processed window. Click on this line to activate it.
11. Click on the protein file name just above the antibody file.
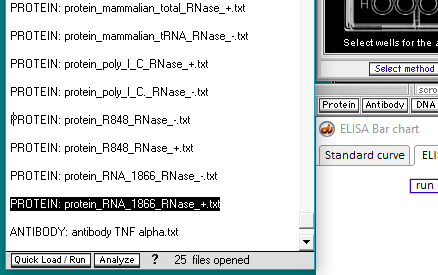
12. Scroll up to the top of the window, and shift-click on the first protein file name. This action will select all 24 protein filenames. (IMPORTANT: Always scroll up to the top, to make sure that all protein files in a folder will be selected).
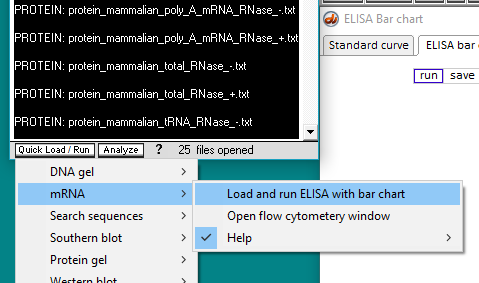
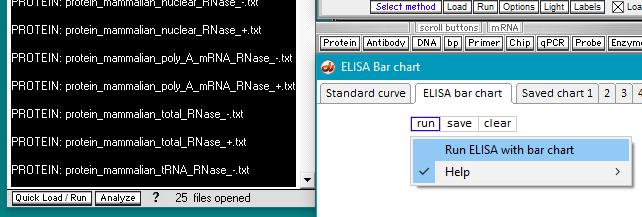
13. Now that an antibody file and all of the protein files have been selected, the ELISA can be run. There are two ways to do this. One way is to click on the Quick Load / Run button and select the mRNA menu item (image directly below), and the other way is to use the Run button on the ELISA Bar chart window (second image). Either method will give the same result.
14. Results of the ELISA run are shown below. O.D. values correspond to the intensity of fluorescence in the wells of the plate.
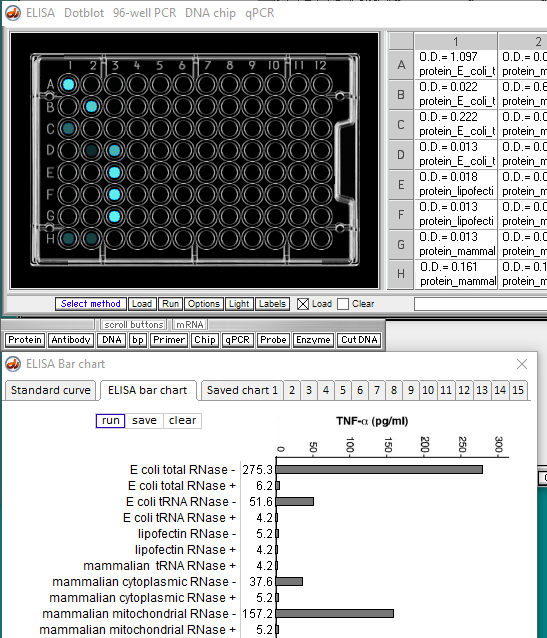
Note: In reality, cytokine ELISA (or any ELISA) would be run with three or more replicates of each sample, and error bars would be calculated and shown for each bar in the chart, as is done in Kariko et al. 2005. Bar charts generated by Case it are representative of those shown in this publication.
15. The heights of the bars are based on the relationship between O.D. and TNF-alpha concentration. Click on the Standard curve tab (upper left) to see this relationship.
Note: In reality, samples of known concentration would be added to the ELISA plate so that a standard curve can be generated for each run. For simplicity, the Case It simulation uses a built-in standard curve equation for each cytokine, shown in the screenshot below for TNF-alpha.
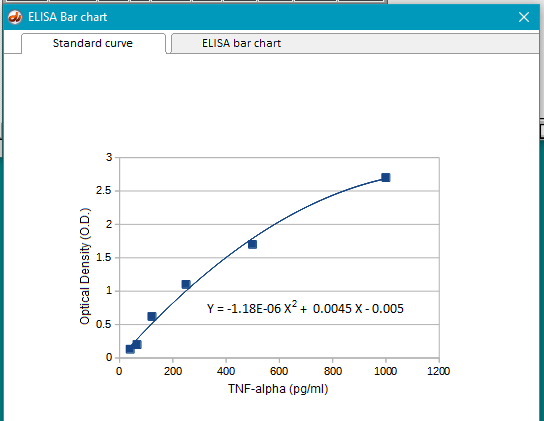
Note: This particular relationship is fit best by a polynomial curve, but other standard curves might be fit best with straight lines, power curves, or straight lines based on log-log transformations, depending on the concentration range. Standard curves with known concentrations are always generated before experimental runs with unknowns.
“Generally, it is useful to perform a dilution series of the unknown samples to be assured that the OD will fall within the linear portion of the standard curve. Depending on the nature of the ELISA reagents used, investigators may choose to apply different curve fit analyses to their data, including either linear-log, log-log, or four-parameter transformations.” Cytokine ELISA protocol, BD Biosciences
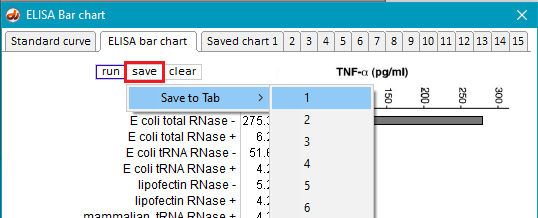
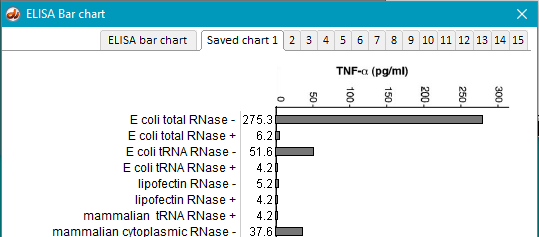
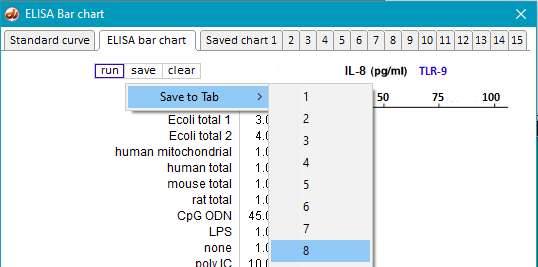
16. Return to the main bar chart by clicking the ELISA bar chart tab at the top of the window, and save the result by clicking the save button and selecting a tab. This method can be used to temporarily* save up to 15 experimental runs. In this example, the bar chart results are saved to Tab 1 (Saved chart 1).
*Note: To permanently save results you need to make screenshots. The easiest way to do this on Windows computers is to use the Windows-Shift-S key combination, then drag the part of the screen you want to save. On Macs, Preview or the Screenshop app can be used.
17. Questions to consider: Screenshots above show only part of the results of the ELISA analysis, as there are a total of 24 bars in the chart. Examine the results you obtained and consider the following questions. Consult the glossary of terms from Part 1 to help formulate your responses.
(1) Compare the response of in-vitro- RNA (RNA 1866) to the responses of natural RNA samples. What are some possible hypotheses that could be tested to explain this result?
(2) Why did the investigators test each substance in the presence and of RNase, and why was only one of the 12 substances unaffected by the presence of this reagent?
(3) Compare results among the mammalian RNA samples tested. How can you explain the differences in response among these samples?
(4) Compare results between the E.coli samples. How can you explain the difference in response between these two samples?
(5) What is a possible reason for the differences in the response of E.coli compared to the mammalian samples?
(6) Why were lipofectin and poly IC included among the substances tested?
(7) Only a single run of the experiment was performed in this simulated example. In reality, how many replicates are usually used when ELISA is run, and why is this done?
DETERMINING THE INFLAMMATORY PROPERTIES OF IN VITRO-TRANSCRIBED mRNA ON TOLL-LIKE RECEPTORS 3, 7 and 8
Goal of Steps 18-29: To compare the production of Interleukin-8 (IL-8) by human 293 cells transformed to express either TLR 3, TLR7, or TLR8, after the cells have been transfected with in vitro-transcribed mRNA. Increased levels of IL-8 are associated with a more intense immune response.
Steps 18-23: TLR-3 samples transfected with in vitro-transcribed mRNA
Steps 24-26: TLR-7 samples transfected with in vitro-transcribed mRNA
Steps 27-29: TLR-8 samples transfected with in vitro-transcribed mRNA
18. Use the Clear button to clear the ELISA plate and all open files. (You do not have to clear the bar chart from Step 16, as it will be automatically replaced when the next ELISA is run.)
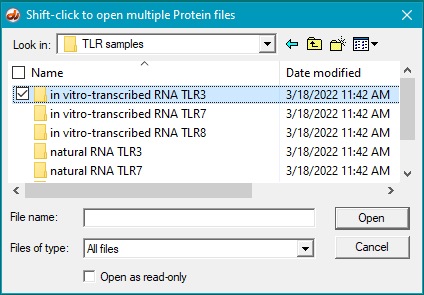
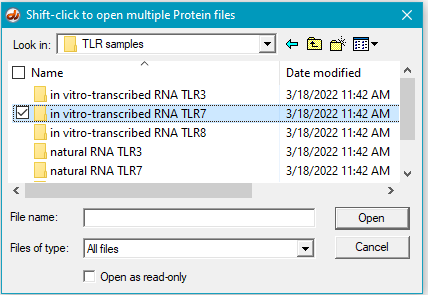
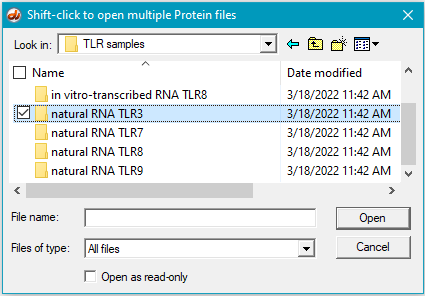
19. Use the Protein button on the silver button bar (as in Step 4 above) and open the TLR samples folder (inside the cytokine ELISA folder).
20. Open the in vitro-transcribed RNA TLR3 folder.
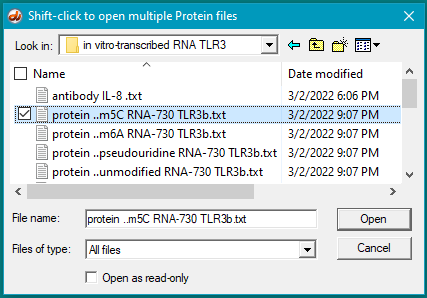
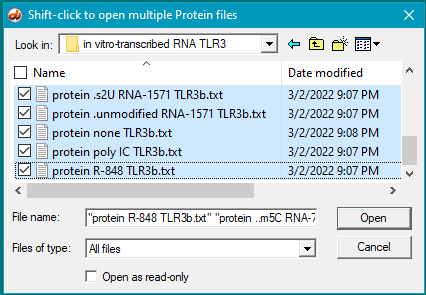
21. Make sure that the files are arranged alphabetically, then click the first protein file, hold down the shift key, click the last protein file, and click the Open button. Filenames will appear in the Opened & processed window (as they did in Step 7 above).
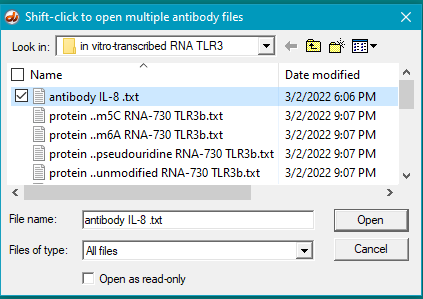
22. Click the Antibody button on the silver button bar and open the file antibody IL-8.txt. The filename will appear in the Opened & processed window (as it did in Step 10 above).
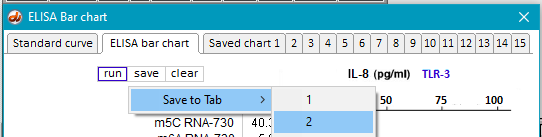
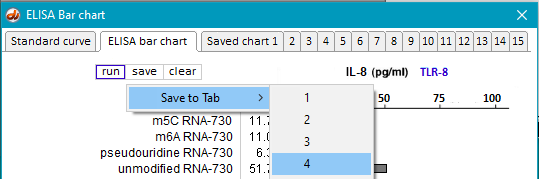
23. Use the procedure in Steps 10-16 above to generate an ELISA bar chart for the samples in this folder, saving the result temporarily on Tab 2 of the bar chart.
24. Clear the ELISA plate and all open files.
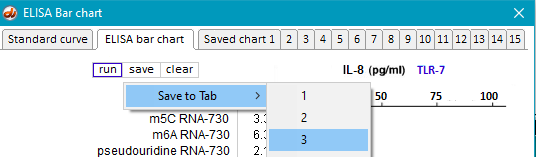
25. Repeat the procedure in Steps 19-23 using samples inside the folder in vitro-transcribed RNA TLR7.
26. Save the resulting bar chart on Tab 3.
27. Clear the ELISA plate and all open files.
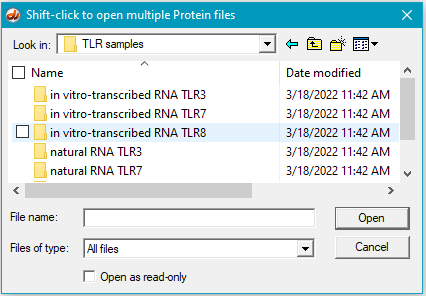
28. Repeat Steps 19-23 using samples inside the folder in vitro-transcribed RNA TLR8.
29. Save the resulting bar chart on Tab 4.
30. Questions to consider: Compare saved charts 2, 3, and 4 and consider the questions below. Consult the glossary of terms from Part 1 to help formulate your responses. Be sure to make your comparisons based on the relative heights of bars, rather than their absolute heights.
(1) What could account for differences in the relative effects of R-848 and Poly IC on the three TLRs?
(2) Is the relative effect of unmodified mRNA the same for the three TLRs? What might account for any differences that you observed?
(3) Are the relative effects of the various nucleoside modifications the same for the three TLRs? What might account for any differences that you observed?
DETERMINING THE INFLAMMATORY PROPERTIES OF NATURAL mRNA ON TOLL-LIKE RECEPTORS 3, 7, 8 and 9
Goal of Steps 31-38: To compare the production of Interleukin-8 (IL-8) by human 293 cells transformed to express either TLR3, TLR7, TLR8, or TLR9 after the cells have been transfected with mRNA from natural sources. Increased levels of IL-8 are associated with a more intense immune response.
Steps 31-32: TLR-3 samples transfected with natural mRNA
Steps 33-34: TLR-7 samples transfected with natural mRNA
Steps 35-36: TLR-8 samples transfected with natural mRNA
Steps 37-38: TLR-9 samples transfected with natural mRNA
31. Clear the ELISA plate and all opened files, then repeat Steps 19-23 using samples inside the folder natural RNA TLR3.
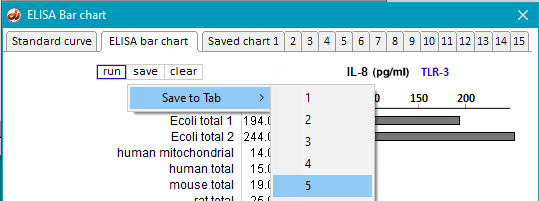
32. Save the resulting bar chart on Tab 5.
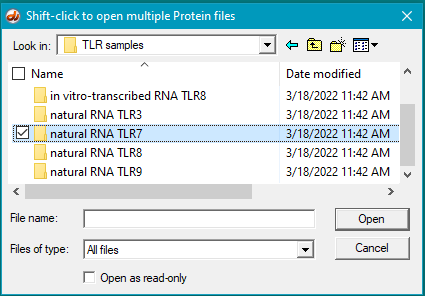
33. Clear the ELISA plate and all opened files, then repeat Steps 19-23 using samples inside the folder natural RNA TLR7.
34. Save the resulting bar chart on Tab 6.
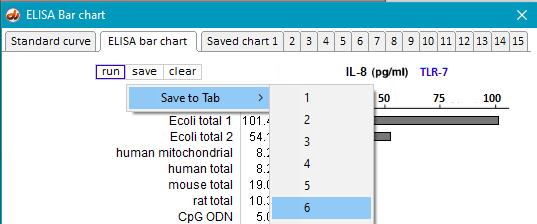
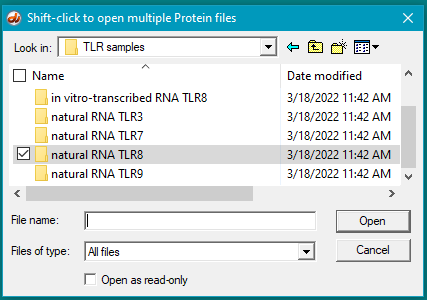
35. Clear the ELISA plate and all opened files, then repeat Steps 19-23 using samples inside the folder natural RNA TLR8.
36. Save the resulting bar chart on Tab 7.
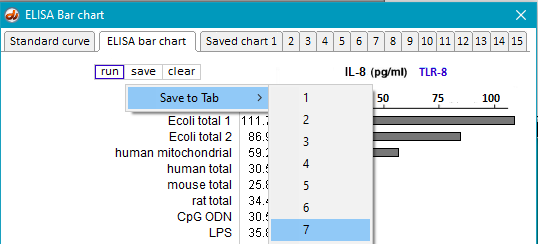
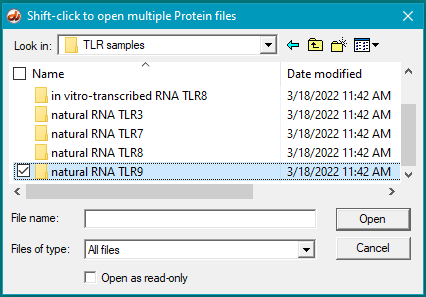
37. Clear the ELISA plate and all opened files, then repeat Steps 19-23 using samples inside the folder natural RNA TLR9.
38. Save the resulting bar chart on Tab 8.
39. Questions to consider: Compare saved charts 4, 5, 6, and 7, then consider the questions below. Consult the glossary of terms from Part 1 to help formulate your responses. Be sure to make your comparisons based on the relative heights of bars, rather than their absolute heights.
(1) All samples used lipofectin as a transfection agent, but only one of them included only lipofectin (the one labeled ‘none’). Why was this sample included in the analysis?
(2) What could account for differences in response between the two E. coli samples?
(3) Compare the E. coli samples with the human, mouse, and rat samples. Are any differences that you see statistically significant? How would you go about determining this?
(4) Why did the results for TLR9 differ from the results for the other TLRs?
(5) How do results from tests of natural RNA provide insight into the results of tests involving in vitro-transcribed RNA?
Go to Part 1: Background information on mRNA vaccines, the immune system, and experimental techniques
Go to Part 3: Determining the effect of mRNA on the immune response of dendritic cells
Go back to the top of this page