| SNP microarray cases: | Prostate cancer | Pharmacogenomics | Cardiac disease | Resistance to HIV infection |
| Expression microarray cases: | Breast cancer | Melanoma | Herpes |
These cases represent simplified versions of microarrays. They are limited to 64 probe spots (features) for each sample. The fluorescence intensity data are based on published papers, adjusted to fit the range of results that can be displayed with the software. The case files are in .csv format, and the data can be modified by users to change the outcomes of the case, add different genes, etc. The data represent the corrected averages that would be calculated from replicates. The probe sequences correspond to the indicated genes or SNPs, obtained from probe databases and published articles.
SNP MICROARRAYS
The SNP probes are organized in pairs of spots, next to each other on the chip, to make it easier to see the relative intensities of the SNPs. See the SNP tutorial for an explanation of the calculations for determining SNP genotypes based on fluorescence intensity ratios, and log-base2-transformed meta-ratios to detected genotype differences between samples. An Excel spreadsheet including the formulas for each calculation is included with the case files. The tutorial and the quick start instructions also provide stepwise instructions for running the microarray simulation. Note that the data in the csv file can be changed to modify the outcome of the analysis.
Case A: Prostate cancer
This case is based on information in Witte, J.S. (2010) Personalized Prostate Cancer Screening: Improving PSA Tests with Genomic Information, Sci. Transl. Med. 2, 62ps55. Three of the SNPs cited in that article are used to distinguish the high and low PSA control PSA samples. Since the specific alleles for the named SNPs that are linked to higher PSA levels are not provided, this has to be derived by comparing the genotypes of the high and low serum PSA controls:
- rs10788160 (FGFR gene): AA = High PSA level; GG = low
- rs17632542 (KLK3 gene): CT = High PSA level; CC = low (T allele associated with higher PSA levels, even in heterozygous condition)
- rs10993994 (MSMB gene): TT = high PSA level, also associated with increased risk for prostate cancer; CT = low PSA level and low risk (C allele associated with lower PSA levels and lower cancer risk, even in heterozygous condition)
According to this study, two SNPs (rs10788160 near the FGFR gene, and rs17632542 in the KLK3 gene) were associated with higher blood PSA levels in the absence of prostate cancer. One SNP (rs10993994 in the MSMB gene) was linked to higher PSA levels but also to higher risk for prostate cancer.
The case: Greg just celebrated his 50th birthday. He does not feel “old” and thought he was in very good health. However, his physician recommended that, because of his age, he undergo screening for various diseases that are more common in men over 50. One of these is the PSA (prostate-specific antigen) test, used to detect potential prostate diseases. Although Greg has not had any of the symptoms associated with prostate disease, he has his blood tested for PSA. His result of 8 ng/ml is outside of the normal range of 0-4 ng/ml. Greg’s physician suggests that they perform a needle biopsy to look for abnormal cells in Greg’s prostate that might indicate inflammation or even cancer. Greg does not want any unnecessary tests, especially any involving needles, and he discusses his concerns with his physician. Greg’s physician just read an article describing men with higher than normal PSA levels in the absence of any prostate disease, and suggests the possibility that higher PSA blood levels may be normal for Greg due to his genetics. The physician arranges for Greg’s DNA to be tested for the SNPs associated with high PSA levels.
Test results for prostate cancer case:
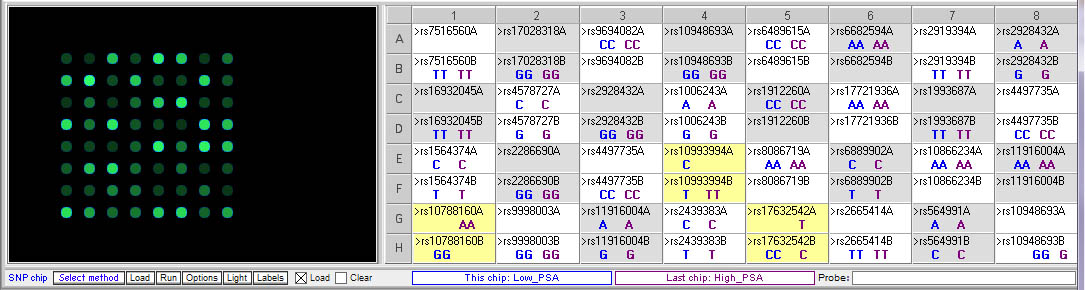
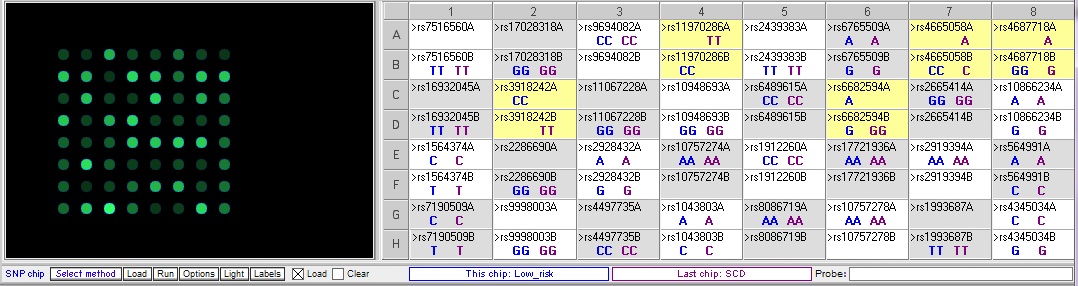
Above: Comparison of low and high PSA chips. Note that there are differences for the three SNPs described in the case scenario:
- rs10788160 (FGFR gene): AA = High PSA level; GG = low
- rs17632542 (KLK3 gene): CT = High PSA level; CC = low (T allele associated with high PSA levels, even in heterozygous condition)
- rs10993994 (MSMB gene): TT = high PSA level, also associated with increased risk for prostate cancer; CT = low PSA level and low risk (C allele associated with lower PSA levels and lower cancer risk, even in heterozygous condition)
Below: Comparing Greg’s genotype to the low PSA control:
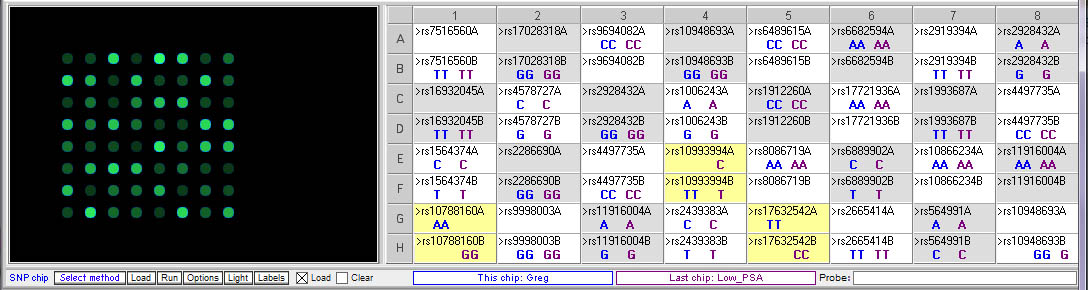
Greg’s genotype (blue) differs from the low PSA control (purple) at all three of the relevant SNPs.
Below: Comparing Greg’s genotype to the high PSA control:
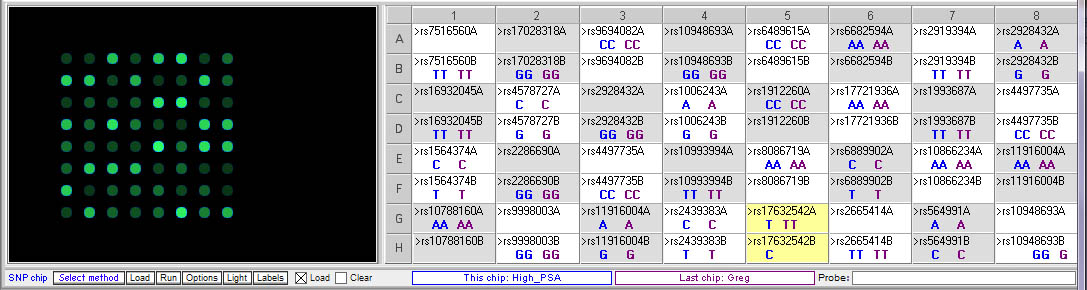
Greg (purple) has the same genotype as the high PSA control for two of the relevant SNPs, rs10799160 rs10992994. His genotype differs from the high PSA control for rs17632542, but he actually has two copies of the T allele associated with higher PSA levels, whereas the high PSA control is homozygous.
Greg’s genotype:
- rs10788160 (FGFR gene): AA (high PSA levels)
- rs17632542 (KLK3 gene): TT (high PSA level; he is homozygous for the T allele, where the high PSA control is heterozygous)
- rs10993994 (MSMB gene): TT (high PSA levels and increased risk for prostate cancer)
1. Does Greg’s DNA contain the SNP alleles associated with high PSA levels?
Yes, he is homozygous for the allele associated with high PSA levels for all three of the relevant SNPs.
2. Should Greg get the needle biopsy? Why or why not?
Needle biopsies are not pleasant, but one could argue that Greg should definitely get one as his risk of prostate cancer is high, and prostate cancer is one of the leading causes of death in males. The risk of permanent damage from a needle biopsy is very low.
Modern robotic prostate cancer surgery (to completely remove the prostate) is far less invasive than in the past, but does not eliminate the possibility for other side effects such as incontinence. There are non-surgical alternatives removal of the prostate (e.g. localized destruction of cancer cells ), but these may not be as effective as complete removal.
“Watchful waiting” is sometimes recommended as an option, meaning that PSA levels can be monitored and action taken if they rise. However, in Greg’s case, this may not be a good option, as by the time the cancer is detected it may have spread beyond the prostate, requiring radiation or chemotherapy with no guarantee of success. Surgical removal of the prostate often requires removal of the nerves surrounding it, nerves that control the erection response in males. This may be a reason why some men opt for “watchful waiting”, as the loss of those nerves can have a major impact on one’s lifestyle, both psychologically and physically. This decision should not be taken lightly, considering the very serious consequences of this disease.
3. How do these results affect the interpretation of Greg’s PSA test results?
Greg has SNP alleles associated with having higher serum levels of PSA, so he is likely to produce a higher result in the PSA test even if he has no prostate inflammation or cancer. However, he is homozygous dominant for the SNP associated with both high PSA levels of increased risk of cancer, so an elevated PSA reading could be serious cause for concern.
4. What role might these gene products play in prostate function?
FGFR – fibroblast growth factor receptor 2, belonging to a family of tyrosine kinase receptors; may lead to an increase in expression of the androgen receptor which could affect prostate function.
MSMB – microseminoprotein beta, a protein found in human seminal plasma; this SNP is near the promoter and may affect regulation of transcription of the gene.
KLK3 – kallikrein-related peptidase 3, the gene that encodes the PSA antigen.
5. Should routine PSA testing continue to be recommended if It is not completely accurate?
This has been controversial, but one could argue that the risk of prostate cancer (and the very substantial cost of not catching it early) outweighs the relatively modest cost of PSA testing.
Case B: Pharmacogenomics
Each year, thousands of people die from drug complications, and millions have adverse side effects. There is significant genetic variability in how patients will respond to certain drugs. For example, Warfarin is an oral anticoagulant drug that is widely used to prevent and treat thromboembolic disease in patients with deep-vein thrombosis, pulmonary embolism, mechanical heart valves, and atrial fibrillation. It inhibits the vitamin K epoxide reductase complex subunit 1 (VKORC1), which results in decreased formation of vitamin K–dependent clotting factors and provides the therapeutic effect of anticoagulation. It is associated with a substantial risk of major bleeding, which can be fatal, and patients taking Warfarin must be monitored closely. SNPs have been identified in genes encoding enzymes that metabolize Warfarin, that are associated with increased risk for bleeding. Additional SNPs in the VKORC1 gene are associated with resistance to Warfarin, rendering it ineffective at protecting against blood clots.
The case: Sally is a 55-year-old woman with a recent history of atrial fibrillation who requires long-term anticoagulation therapy. She and her daughter are quite concerned about the potential for bleeding and ask the pharmacist about their concerns. The pharmacist suggests that Sally undergo genetic testing to avoid this adverse event. Sally’s DNA is tested for SNPs associated with higher risk of excessive bleeding due to Warfarin.
This case is based on information in Daly, A. (2010) Genome-wide association studies in pharmacogenomics. Nature Reviews/Genetics, Vol. 11, 241-246. In addition to the patient, Sally, there is one sample that has a SNP associated with excessive bleeding in response to warfarin (warfarin-sensitive) and one sample with a SNP associated with resistance to warfarin, rendering it ineffective. Comparing Sally’s DNA to these samples yields the following differences between the samples:
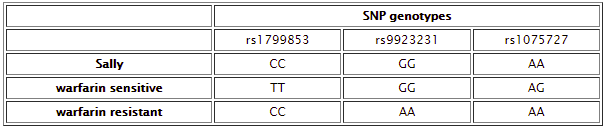
Below: Comparison of warfarin sensitive and warfarin resistant SNPs, corresponding to the chart above.
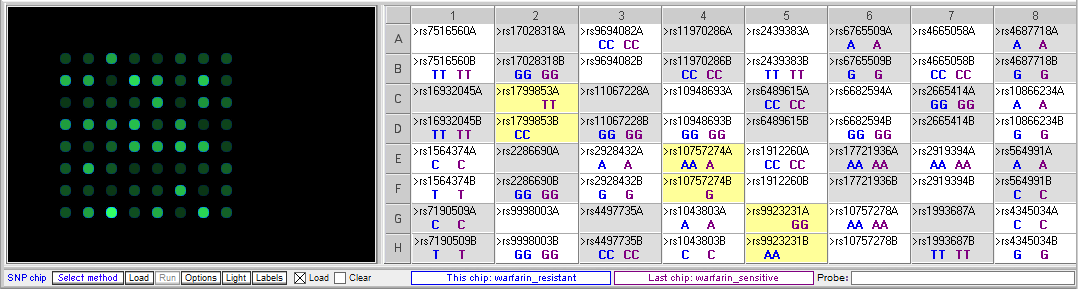
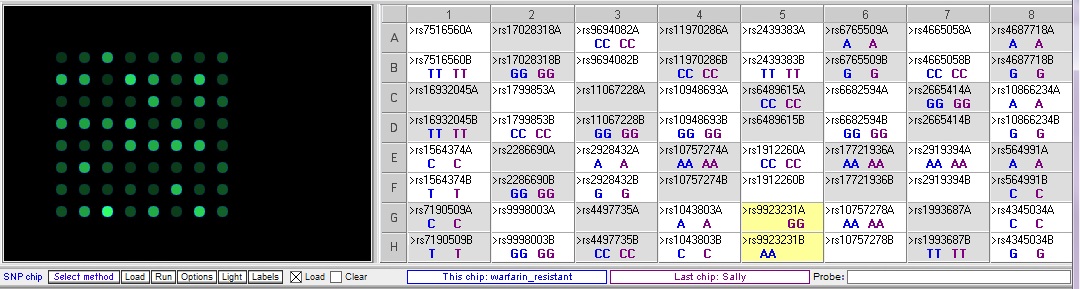
Below: Sally vs. the warfarin-resistant sample (warfarin is not effective at reducing clotting). Sally does not have one of the three SNP alleles associated with resistance.
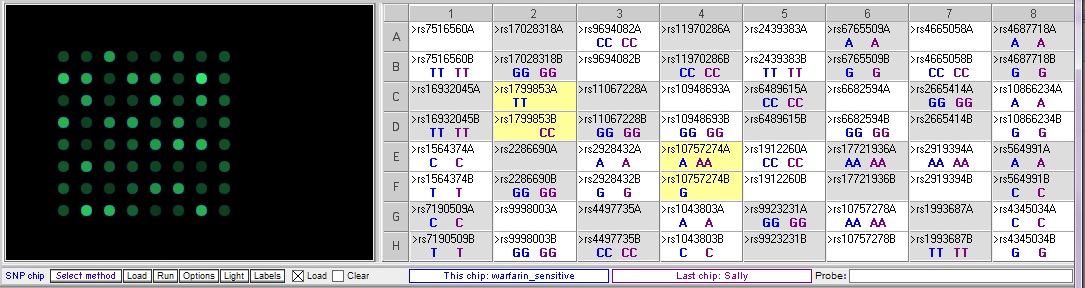
Below: Sally vs. warfarin-sensitive (excessive bleeding) sample. Sally does not have two of the three SNP alleles associated with excessive bleeding in response to warfarin. The other SNP difference, rs10757274, is not associated with warfarin metabolism.
- Based on the results of these tests, should Sally be prescribed Warfarin to treat her atrial fibrillation?
Sally does not appear to have all of the SNPs that would be associated with abnormal responses to warfarin, so based on these results it could possibly be prescribed for her. However, since there are such potentially dangerous side effects, and she does have some of the SNPS, she should be monitored closely at the beginning of the treatment. - What other recommendations do you have for Sally to help her manage her health?
This is a complicated condition, and exact treatment recommendations depends on the details of her clinical information. There is a lot more information at web sites like eMedicine, http://www.emedicinehealth.com/atrial_fibrillation/article_em.htm - What are the functions of the SNP-associated genes and how are they involved in modulating the effect of Warfarin?
rs1799853 is in the CYP2C9 gene, Cytochrome P-450 family. C is the wild type allele. The T allele causes a missense mutation that causes a decrease in warfarin metabolism and can results in excessive bleeding.
rs9923231 is near the promoter for the VKORC1gene, vitamin K epoxide reductase complex. The A allele is associated with insensitivity to warfarin, so it does not inhibit clotting.
rs1075724 is in CDKN2B, non-coding RNA which is not associated with warfarin metabolism
Case C: Cardiac disease
This case is based on information reported in Arking DE, et al. (2011) Identification of a Sudden Cardiac Death Susceptibility Locus at 2q24.2
through Genome-Wide Association in European Ancestry Individuals. PLoS Genet 7(6): e1002158. doi:10.1371/journal.pgen.1002158.
The case: Jonathan is a 44-year old male who is in good health, although he is about 30 pounds overweight. It has been a difficult year for Jonathan. His marriage ended, and after a bitter custody fight he has full custody of his two daughters, ages 7 and 9. Soon after, he lost his full time job. He quickly found work again in a position that pays a lower salary. but he feels lucky, though, to have found a job that provides health insurance. He blames the stress of the past year for the fact that he has gained weight. It has been hard to find time to exercise with his new job and taking care of his daughters. So he was relieved when his recent physical exam indicated that his overall health was reasonably good. His cholesterol levels were slightly elevated since his last exam, but his blood pressure was in the normal range.
Jonathan has been concerned about heart disease ever since a former classmate, who had seemed in perfect health, died of a sudden heart attack while running a 10K race. Jonathan does not know very much about his own family history of heart disease since his father died in a car accident when Jonathan was very young, and he has few other male relatives. When he mentioned his concerns to his physician, he tells Jonathan that there is a genetic test that can determine whether his DNA contains certain SNPs associated with sudden cardiac disease. Having one of these SNPs may be associated with a 2-5 times greater chance of sudden myocardial infarction (heart attack). Having more than one of the associated SNPs can increase the risk significantly. Since this clinic is involved in researching the role of these SNPs in sudden cardiac disease (SCD), Jonathan can get his DNA tested for no cost. He decides to go ahead with the test and submits a blood sample.
For this case, the alleles associated with increase risk for sudden cardiac disease are provided. Therefore, one can just run the microarray for Jonathan’s sample and note his genotype for each SNP. However, comparing Jonathan’s genotype to the control samples for low risk and high risk for SCD are informative, since they illustrate that there can be additional SNP differences between these samples that are not related to this particular condition.
Comparing the control sample for low risk of cardiac disease to the control sample from sudden cardiac disease (SCD):
The sudden cardiac disease (SCD) sample is homozygous for the risk allele for two of the relevance SNPs, rs3918242 and rs11970286, and heterozygous for the other two SNPs, rs4665058 and rs4687718. There is one more SNP that differs between these two samples, rs6682594, but this one is not associated with cardiac disease.
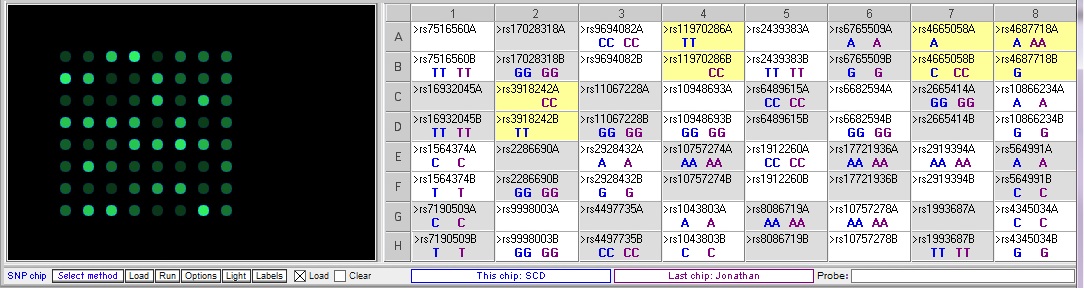
Comparing Jonathan’s genotype to the low risk sample:
Jonathan only differs from the low risk sample at one of the relevant SNPs, rs4687718. He also differs at rs6682594, but this is not associated with cardiac disease
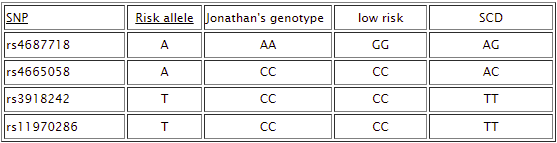
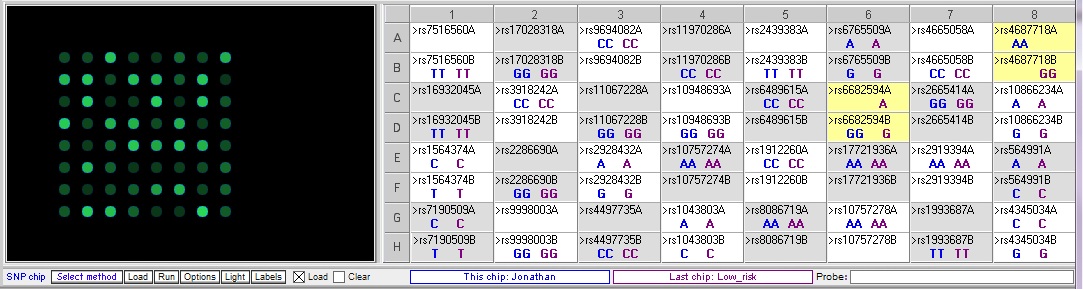
Comparing Johnathan’s genotype to the high risk for SCD sample:
Jonathan has a different genotype compared to the SCD control sample at each of the relevant SNPs. However, he differs at rs4687718 in the he is homozygous for the risk allele A, while the SCD control is heterozygous.
- Does Jonathan’s DNA contain any of the SNPs associated with risk for sudden cardiac disease? How would you explain the results of the test to him?
Jonathan only has the risk allele at one out of four relevant SNPs. However, he carries two copies of that allele (homozygous). The control sample only had one of the risk alleles at this SNP, but this sample also has risk alleles at all four SNPs. So Jonathan’s risk for SCD may only be moderately higher. - What would you recommend to Jonathan in terms of managing his health and reducing his risk of cardiac disease?
Jonathan needs to find a way to manage his stress levels. He also should make time to exercise and eat a healthy diet with and to get his weight within the normal range. He should monitor his cholesterol levels and consider medication to reduce his levels if they continue to increase. He should regularly check his blood pressure and discuss any concerns with his physician. - Should Jonathan be concerned about the results of his DNA testing being used in a research study, or being shared with anyone else?
He should make sure he reads and understand the consent form he signed when he agreed to submit his blood sample. The hospital and researchers are required to follow HIPAA privacy regulations. - Are there SNPs other than those mentioned in the tables whose genotype pattern indicate they might be associated with increased risk for cardiac disease?
This is one additional SNP that differed between the low risk and high risk controls, rs6682594. However, even if this SNP turns out to be associated with cardiac disease risk, Jonathan has the same genotype as the low risk control.
rs4687718: TKT gene – transketolase, a thiamine-dependent enzyme which plays a role in the channeling of excess sugar phosphates to glycolysis in the pentose phosphate pathway; involved in development of adipose tissues
rs4665058: BAZ2B gene – bromodomain adjacent to zinc finger domain, otherwise the function of this protein is largely uncharacterized. The SNP is located in an intron - Are these SNPs located in or near genes? If so, what are the functions of these genes in cardiac function?
These SNPs are linked to increased timing of a particular cardiac rhythm measure during echocardiograms, called the QRS/QT interval. All of the genes associated with these SNPs are expressed in cardiac tissue during development.
rs4687718: TKT gene – transketolase, a thiamine-dependent enzyme which plays a role in the channeling of excess sugar phosphates to glycolysis in the pentose phosphate pathway; involved in development of adipose tissues.
rs4665058: BAZ2B gene – bromodomain adjacent to zinc finger domain, otherwise the function of this protein is largely uncharacterized. The SNP is located in an intron.
rs3918242: MMP9 gene – matrixmetalloproteinase 9, a type IV collagenase that degrades the collagen in extracellular matrices; involved in inflammation; increases in inflammation markers like MMP9 are linked to cardiac disease.
rs11970286: PLN gene – phospholamban, controls calcium levels in cells; specifically inhibits the sarcoplasmic reticulum in cardiac muscle; linked to hypertrophic cardiomyopathy in some studies.
Case D: Resistance to HIV infection
This case is based on information from the following articles:
Kaslow, R.A. et al. (2011) Influence of Host Genetic Variation on Susceptibility to HIV Type 1 Infection. J. of Inf. Dis. 2005; 191(Suppl 1):S68–77
Ping, A. and Winkler, C.A. (2010) Host genes associated with HIV/AIDS: advances in gene discovery. Trends in Genetics Vol.26 No.3, 119-131
The case: Researchers have been studying a population of Kenyan sex workers who appear to be resistant to HIV infection despite repeated exposure to the virus. Identifying the mechanism for HIV resistance could lead to treatments that would protect individuals at risk for HIV exposure. To determine whether there are genetic factors that contribute to this resistance, the researchers obtained blood samples from HIV-resistant sex workers as well as from individuals who became infected with HIV upon exposure, and isolated DNA from these samples. A SNP microarray was performed to identify any SNPs consistently associated with HIV resistance.
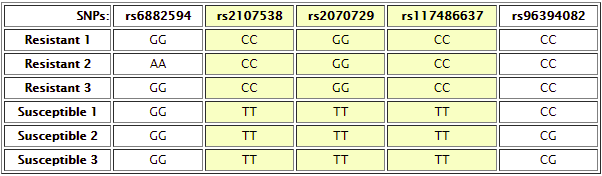
For this case, students compare DNA from individuals resistance to HIV infection and susceptible to HIV infection. Comparing the various resistant and susceptible individuals results in the identification of the following SNPs which show differences between at least some resistant and susceptible individuals:
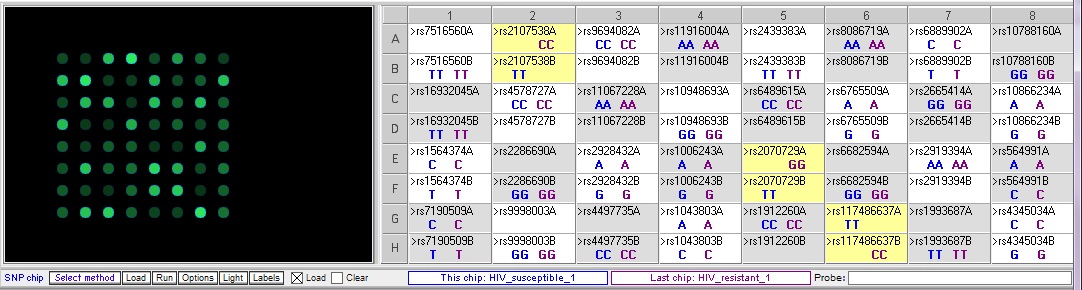
Each HIV-resistant sample should be compared systematically to each HIV-susceptible sample, to identify SNPs consistently associated with resistance vs susceptibility. A few examples are shown below:
Resistant 1 vs. susceptible 1 – note that there are three SNPs where the genotypes are different between the two samples.
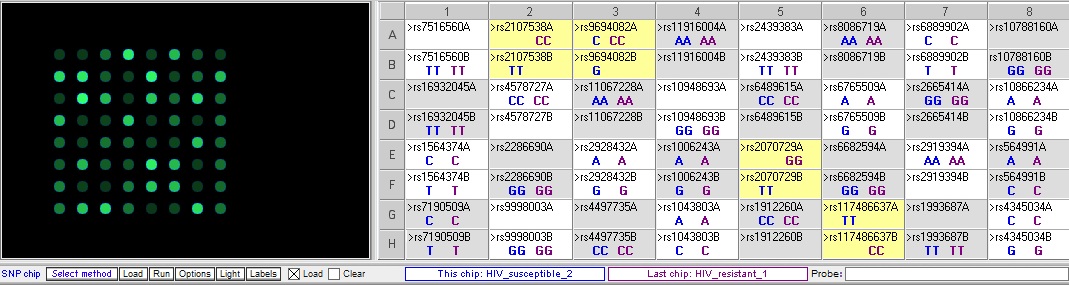
Resistant 1 vs Susceptible 2 – note that the three SNP differences seen in the result above are also different between these samples, but there is an additional difference at rs9694082:
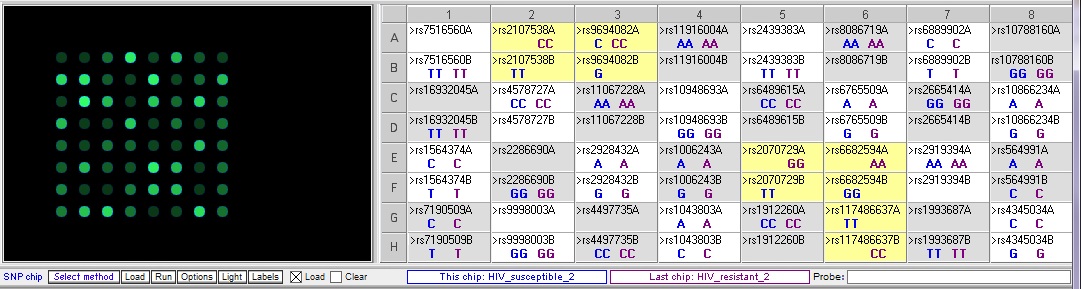
Resistant 2 vs. susceptible 2 – There are five differences, three of which overlap with the differences in the two comparisons above:
- Are there SNPs that appear distinguish the resistant vs. susceptible individuals?
Yes, rs2107538, rs2070729 and rs117486637 - Do any of these SNPs appear to be in or near genes that you would expect to be involved in HIV resistance? What is the gene function?
rs2107538: near the CCL5 gene, encoding a chemokine also known as RANTES; binds to the CCR5 receptor on CD4 cells, which is a co-receptor for HIV
rs2070729: near the promoter for IRF1, interferon regulatory factor 1; regulates expression of type 1 interferons, which interfere with virus multiplication
rsrs117486637: HLA-B, major histocompatibility complex class I protein, involved in cytotoxic T cell recognition and destruction of virus-infected cells - How might a change in one nucleotide affect the ability of a cell to be infected by HIV?
A single nucleotide change can alter the 3-dimensional structure of the protein, which can alter or inactivate the function of the protein. If this is a receptor protein for HIV, the virus may not be able to bind as well (or may bind better) if the protein structure has changed. For the three genes identified above, changes in the protein structure/function could affect the ability of HIV to infect cells; CCL5 may compete with HIV for binding to CCR5, IRF1 may interfere with virus multiplication in the infected cells, and the ability of HLA-B to interact with HIV and activate cytotoxic T cells could affect how well the immune system eliminates HIV-infected cells before they can produce more virus.
EXPRESSION MICROARRAYS
Expression microarray quick start instructions
Video tutorial for expression microarrays – for more in-depth information
The files for these cases are .csv files containing numbers representing fluorescence intensity data. The data for these microarrays are simplified, and represent corrected average values that would be present in a full microarray. A simple ratio is calculated to determine relative increases or decreases in experimental tissue or cells compared to control samples. The values can be modified or extended (e.g. calculating log-transformed values) as desired.
The program does not simulate clustering, and most cases do not have the multiple samples necessary to carry out cluster analysis. For a single microarray, the probe spots can be re-ordered to group similar colors together, for ease of analysis.
Case A: Breast cancer
This case is based on information in Habel, L. et al. A population-based study of tumor gene expression and risk of breast cancer death among lymph node-negative patients, Breast Cancer Research 2006, 8:R25 (doi:10.1186/bcr1412)
Researchers have identified genes whose increased expression is associated with increased proliferation, or rapid growth in breast cancer tumors: Ki-67, STK15, Survivin, Cyclin B1, MYLB2. Other genes are associated with increased tumor cell invasion if their expression is increased: Stomelysin 3 and Cathepsin L2. Some breast cancers cells respond to the hormone estrogen by proliferating, which provides a possible mechanism for treatment since estrogen receptors can be blocked. Increases in the expression of estrogen receptor genes might indicate these cells are responsive to the hormone.
The case: Sarah was devastated when she received a diagnosis of breast cancer. It did not seem to run in her family, so she assumed she did not have to worry about it. She is grateful for the support of her friends, especially Molly, who is a clinical lab pathologist. Molly is helping her think about the difficult decisions about how aggressive her treatment should be, in terms of surgery, chemotherapy, etc. She explained that the oncologist recommended running a lab test that uses a microarray to measure the expression of specific genes. The pattern of gene expression can predict how quickly the tumor cells will grow and whether they will respond to treatments. Sarah is meeting with the oncologist to review the results, and she has asked Molly to go with her.
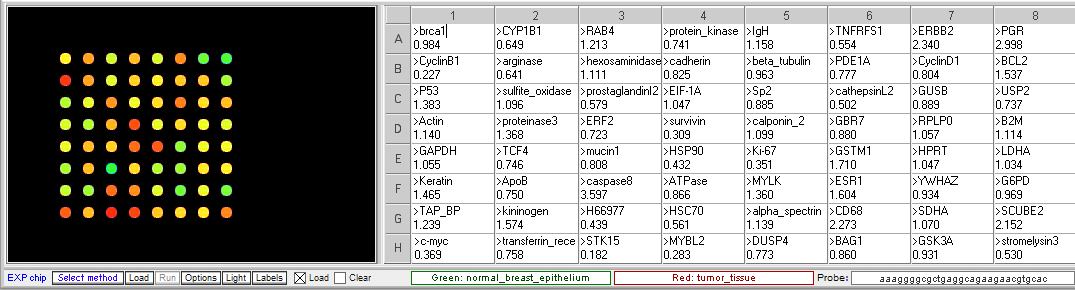
Original spot arrangement
Grouped according to color
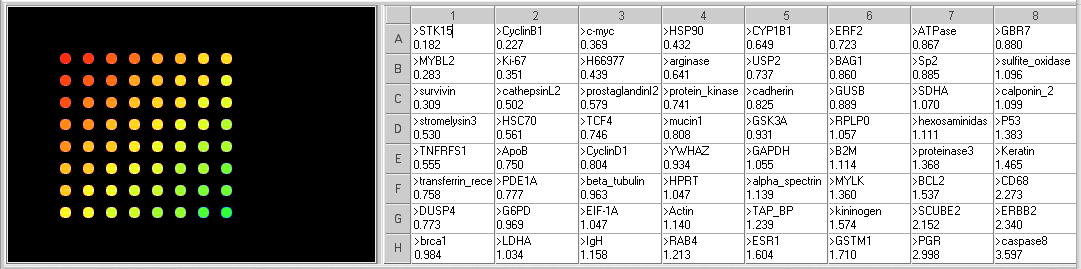
- What genes are elevated in the tumor tissue? What genes are decreased?
Genes with increased expression in tumor cells (<0.5 ratio): STK15, CyclinB1, MYBL2, C-Myc, Ki67, Survivin, H66977, and HSP90.
Genes with decreased expression in tumor cells (>2.0 ratio): CD68, SCUBE2, PGR, ERBB2, caspase8. - What are the function of the genes with the most significant difference in expression between normal and tumor tissue?
All of the genes with increased expression in the tumor tissue, except H66977, are associated with increased cell division in tumor cells. H66977 is ALAD, aminolevulinate dehydratase, involved in prophyrina and heme synthesis, and not known to be related to tumor growth.
Of the genes with decreased expression in the tumor cells, SCUBE2, ERBB2 and PGR are involved in estrogen responsiveness. Caspase8 function in the induction of apotosis, so a decrease may mean the cells are more likely to divide than enter apoptosis. CD68 is a membrane protein usually expression on monocytes and macrophages, which has been shown to be elevated in some aggressive tumors. - Does that pattern of gene expression provide any information about Sarah’s prognosis?
The pattern suggests that her tumor will grow rapidly. However, the genes associated with aggressive invasion of other tissues are not elevated to the same degree, so the may mean it will be slower to spread. But quick, aggressive treatment would probably be recommended. The results also suggest that the tumor cells are not likely to be estrogen-responsive, so therapies that block estrogen receptors may not be effective.
Case B: Melanoma
This case is based on information in the following papers:
Zhou, Y. et al. (2005) Osteopontin Expression Correlates with Melanoma Invasion. J Invest Dermatol 124:1044 –1052
Pavey, S. (2004) Microarray expression profiling in melanoma reveals a BRAF mutation signature. Oncogene 23, 4060–4067
The case: Catherine usually did not spend much time looking closely at her skin. At 23, she was not yet worried about the signs of aging. Growing up on the gulf coast of Texas, she had spent most of her summers on the beach without worrying very much about excessive sun exposure. Her college roommate and best friend, who was from Minnesota, constantly commented on how attractive Catherine’s tanned skin was, and what a “healthy glow” she had. So when her physician questioned her about a large mole on her shoulder, she could not really tell her whether it had changed in appearance recently. She had many moles and did not pay much attention to them. But once it had been pointed out to her, and after doing some internet searching on how to identify potential skin cancers, she became anxious enough to seek the advice of a dermatologist. After examining the mole, the dermatologist recommended a biopsy, since it appeared to be abnormal. The pathologist report came back as “uninterpretable”, because there was some trauma to the tissue during the excision and processing that made it difficult to characterize the cells. A second biopsy with wider margins was planned, but in the meantime the original tissue sample was submitted for an experimental evaluation that involved extracting RNA for purposes of gene expression studies that might provide more information about whether the tissue contained cancerous cells. A biopsy of a mole with a normal benign appearance was taken for comparison.
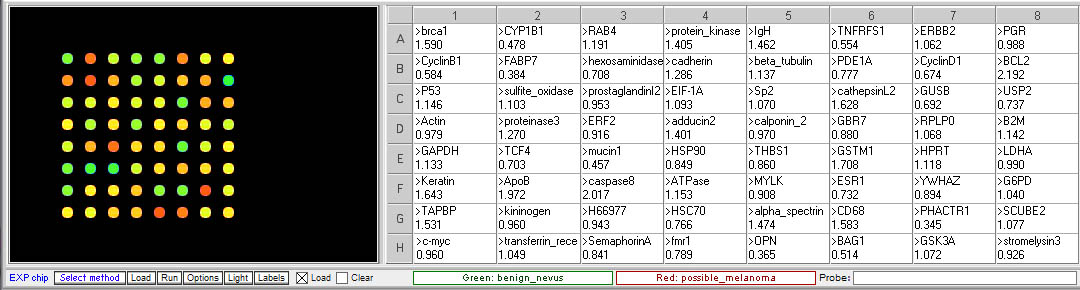
Original spot arrangement
Grouped according to color
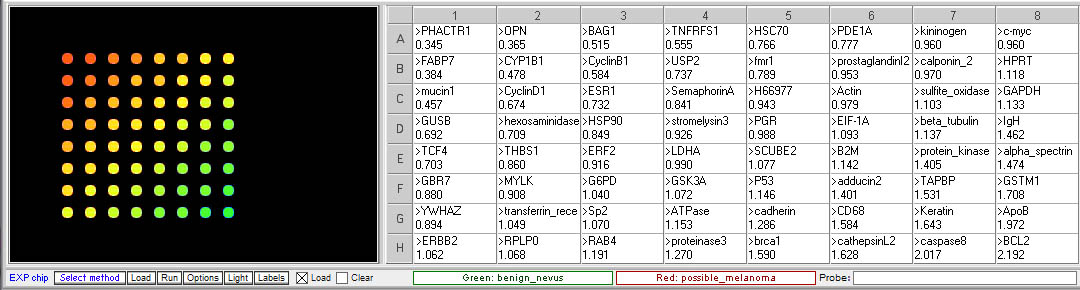
- Is the expression of any of the gene associated with invasive melanoma elevated in the questionable mole sample relative to the benign mole?
Yes, three of the genes associated with invasive melanoma are elevated, suggesting that this sample is melanoma rather than a benign mole. - Are there any other differences in gene expression between the two samples? If so, what are the functions of the genes showing differential expression?
Genes with elevated expression in the suspicious more sample (<0.5 ratio):
mucin1 – transmembrane, heavily glycosylated protein usually expressed by secretory epithelial cells; may be produced under stress conditions
CYP1B1 – Cytochrome P450 family, involved in oxidative metabolism
Genes with decreased expression (>2.0 ratio):
caspase8 – aspartate-specific cysteine protease involved in apoptosis
BCL2 – membrane protein involved in preventing apotosis if overexpressed - What would you recommend to Catherine based on the results of this analysis?
She should return to her physician and continue with further biopsy as planned. It is likely she will need aggressive treatment. - What else could Catherine do to reduce her risk for melanoma?
Protect her skin from ultraviolet light by using sunscreen and protective clothing.
Case C: Herpes simplex virus multiplication
This case is based on information at the Dr. Edward Wagner’s Herpes Virus Research page, http://darwin.bio.uci.edu/~faculty/wagner/hsv9fnew.html. The nomenclature for viral gene names used on this site was adopted for the microarray samples, as described in the Table of Genetic Functions Encoded by HSV-1 linked in the left panel of the main page. The site also includes animations and additional background information about HSV research.
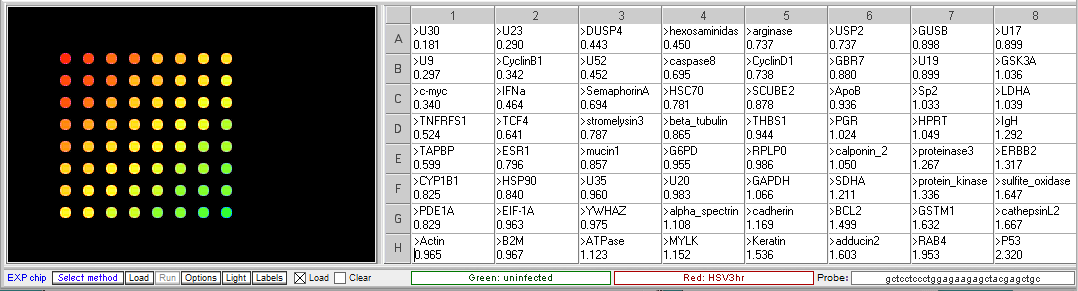
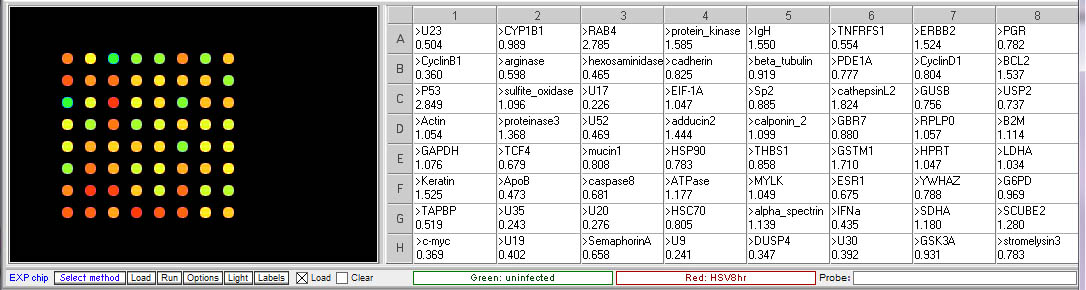
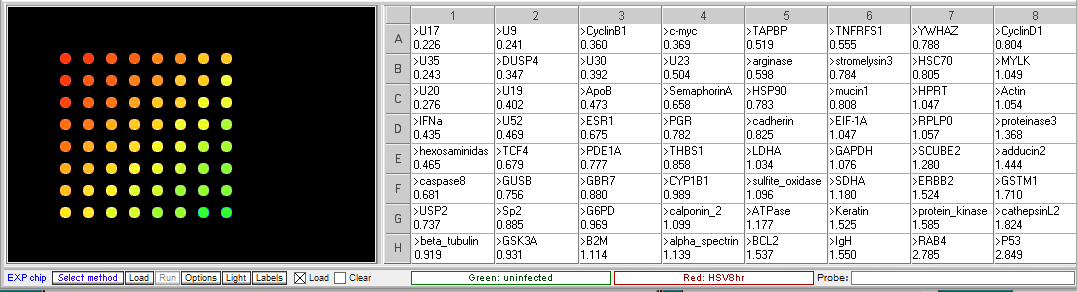
Microarrays can be used to determine a time course of virus gene expression during the infection of cells in culture. Virus multiplication cycles include attachment to the cell and penetration of the cell membrane, replication of the virus genome synthesis of virus proteins, and assembly and release of new virus particles. Virus gene expression is regulated temporally, with some genes expressed early in the multiplication process, while other genes are not expressed until later in the process. In this experiment, HSV-1 was used to infect HeLa cells. Samples of infected cells were taken at 3 and 8 hours, and total RNA was extracted. The RNA was copied into cDNA, incorporating Cy5 (red) fluorescent dye into the cDNA. RNA was also extracted from the uninfected HeLa cells, and cDNA was copied incorporating Cy3 (green) dye.
Procedure: To analyze the results of this experiment, open the file “Expr HSV 3hr.csv” and run the microarray. Compare the levels of gene expression, indicated by fluorescence intensity, in the sample from uninfected and HSV-infected cells. Note which genes appear to be elevated in the virus-infected cells at that time point, relative to uninfected cells. Then repeat this procedure with the file “Expr HSV 8hr.csv”. Genes that were not elevated at 3 hr but appear at 8 hr would be considered “late genes”. Click here for background information about HSV microarray experiments and to identify the virus genes (HSV gene names include the letter U followed by a number). Probe sequences can also be submitted to BLAST analysis to gain more information about the genes.
Results of Herpes virus multiplication microarrays
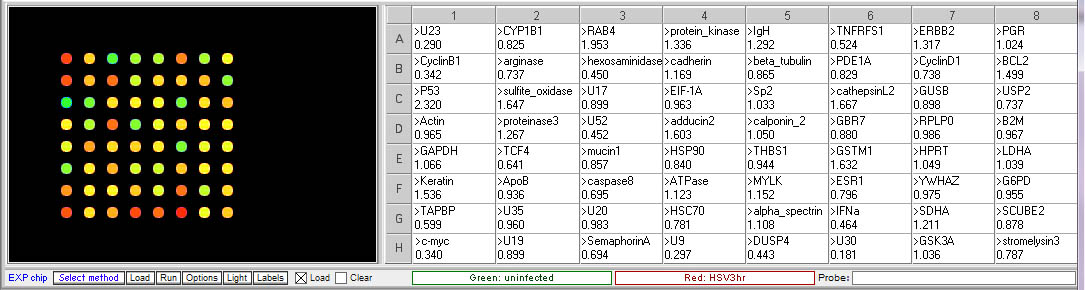
3 hr post infection:
8 hr post infection:
- Which HSV genes would be designated “early” genes based on these results? What are their functions in virus multiplication?
U30, U23, U9. U30 is the gene for DNA polymerase. U23 is the gene that codes for Thymidine kinase for the phosphorylation of the thymine nucleotides. U9 codes for the Ori binding protein used in DNA replication. - Which HSV genes would be designated “late” genes based on these results? What are their functions in virus multiplication?
U17, U20 and U35. U17 is the gene coding for the cleavage and packaging of DNA. U20 is membrane associated and used for virion egress. U35 codes for capsid proteins specifically the capsomere tips. - Which cellular genes show increased expression in HSV-infected cells relative to uninfected cells? What role would these genes have in virus multiplication?
TCF4- transcription factor 4, a helix-loop-helix transcription factor. The encoded protein recognizes an E-box binding site- a motif first identified in immunoglobulin enhancers that can aid in the transcription of the virus genome
CyclinB1 – This is a regulatory protein that in involved in mitosis; viruses multiply in dividing cells and utilize cell machinery for DNA and protein synthesis
C-Myc – transcription activator that can induce cell division